

In todays Weekend Special Edition we will be discussing Elliott Waves. For some technical analytsts Elliott Waves are a vital tool. As any investor the Technical Investor will want to have a reliable forecasting method. The possibility of easy profits by forecasting the market has been the underlying force that motivates so many investors. Elliott’s market model relies heavily on looking at price charts. Practitioners study developing trends to distinguish the waves and waves structures that we will refer to later in this article. The application of the Wave Principle is a form of pattern recognition. To obtain a full understanding of the Wave Principle including the terms and patterns, I recommend Elliott Wave Principle by A.J. Frost and Robert Prechter.
The Elliott Wave Theory was introduced by Ralph Nelson Elliott during the 1930’s. Elliott a full-time accountant believed that stock trends follow a repeating pattern which can be forecasted both in the long and in the short term. The Elliott Wave Theory was published in his book “The Elliott Wave Principle” in 1938. Using data from stocks he concluded that what seems to be a chaotic movement, actually outlines a harmony found in nature. Elliott’s discovery was completely based on empirical data, but he tried to explain his findings using psychological reasons. The main principle of this theory was that a pattern consists of eight waves as can be seen in the Image below.
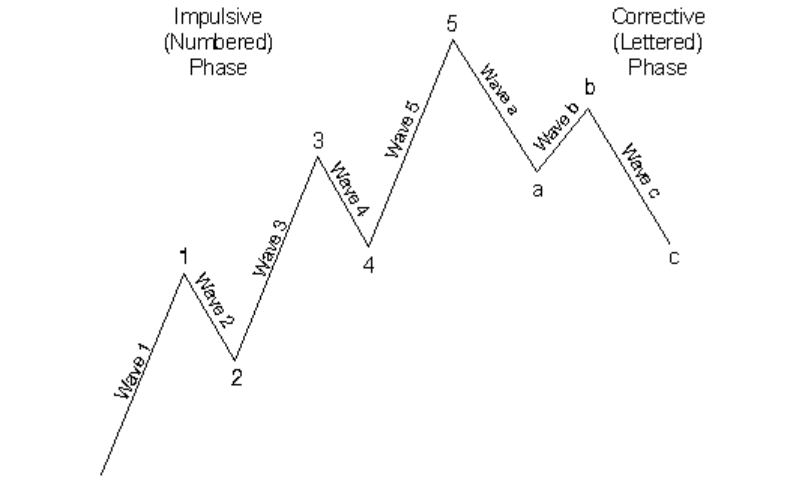
It is visible that Wave 1, Wave 3 and Wave 5 follow the cyclical trend while waves 2 and 4 correct the underlying trend waves A, B and C correct the overall trend , while Wave A and C follow the correction and Wave B resists. Elliot observed that each wave consists of smaller waves which follow the exact same pattern as is shown in the Image below, thereby forming a super-cycle. The numbers in the Image represent the number of waves when counted in a different scope. For example the whole diagram represents two big waves, the impulse and the correction. The impulse consists of 21 usb-waves which in turn consist of 89 smaller waves, while the Correction wave consists of 13 sub-waves, which in turn, consist of 55 even smaller waves. As can be observed all of the above numbers are part of the Fibonacci series. According to the Elliott wave theory, when Elliott first expressed his theory he was not aware of the Fibonacci series.

Elliot believed that there are nine cycles, of different durations, the bigger of which, is formed by the smaller ones. From the largest to the smallest cycles there are:
- Grand supercycle: multi-century
- Super-Cycle: multi-decade (40 to 70 years)
- Cycle: one year to several years
- Primary: a few months to a couple of years
- Intermediate: weeks to months
- Minor: weeks
- Minute: days
- Minuette: hours
- Subminuette:minutes
The duration of these cycles varies from minutes to decades. Each pattern (cycle) is outlined by the following rules:
- The Second Wave cannot be longer than the first wave and cannot return to a lower price than that set at the beginning of the first wave
- The third wave is never the smallest wave compared to the first and the fifth.
- The fourth wave does not return to a lower price than the price found at the end of the first wave. The same applies for wave a.
- Usually the third wave shows a greater dynamic, except in some cases where the fifth wave is extended (the case when the fifth wave is made up of five smaller waves)
- The fifth wave usually leads to a higher point than the third.
When it comes to the interpretation of the waves we will present a short overview of the general dynamic of the waves. The first wave is the “new beginning” of an impulse. Opening a position at this point will be the most profitable scenario. It is difficult to differentiate it from a correction of a previous downtrend, and therefore it is not a powerful wave. Most investors prefer to wait for better timing. The force behind the wave pattern is the number of investors that decide to enter and exit the market at a given time. After some initial winnings, investors decide to exit the market as the price becomes higher, and the stock becomes overpriced for these few investors. This behavior translates in the second wave. As the price begins falling, the stock becomes more attractive for a great number of investors that regretted not having entered the market during the first wave. As the price begins falling, the stock becomes more attractive for a greater number of of investors that regretted not having entered the market at a higher price. Those who entered in the beginning of the wave, are satisfied with their winnings, and have most likely exited the market. Investors realize that the price has reached a level making it difficult to attract any further investors. Demand begins falling, which leads to the fourth wave. Major investors are out of the market, waiting for the end of the fourth wave, to enter again and reap in the profits of the fifth wave. It is important to note that the fourth and the fifth wave are the easiest ones to follow, as they come after the third wave which is the easiest to spot, due to its length, power and speed. Major investors have bought stocks on lower prices, from investors that had bought them during the end of the third wave who feared the price might go lower. However as the major investors enter the market again, they create a small hype, the fifth wave, smaller than the third wave, which usually reaches the peak of the third wave and sometimes even higher. Investors who know the market, know that the market is extremely overrated and therefore have exited the market. Wave A is a corrective wave which is often mistaken for a second wave. This explains wave B. Smaller investors think that wave A corrected the price enough, so that it can lead to an upward trend. Unfortunately, this is the Wave where most smaller, and occasional investors lose huge amounts of money, as Wave C starts, pushing the price lower until the price gets underrated again, for a new pattern to start.
The above explanation is by no means a statistical explanation of the wave behavior, but explains the difference between major and occasional investors and their knowledge of the market. It is exact to know the exact wave patterns , otherwise it is very easy to misinterpret signs. It is important to note that the following explanation regards an overall impulse trend. The opposite would happen in case of an overall correction.
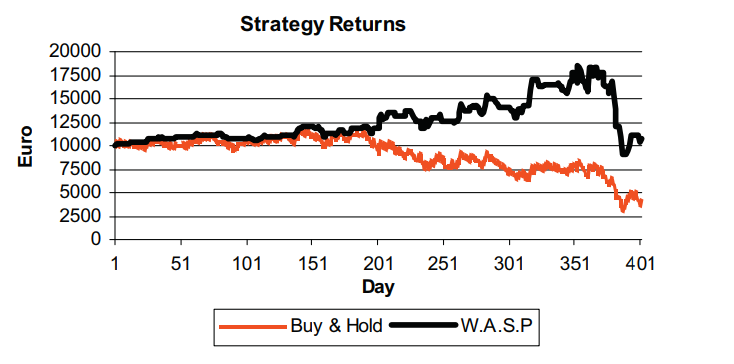
Atsalakis et al (2011) compared the Elliott Wave principle to a Buy and Hold Strategy with remarkable results. The Elliott Wave Principle was tested with the stock of the National Bank of Greece. A paper portfolio worth 10.000 Euros was simulated. Buy and sell decisions did not take into account the confidence index, as it is subjective, depending on the risk the investor is willing to take, even though a threshold of 52% is widely acceptable. Stocks were bought whenever the forecast was positive, and the position was closed when the forecast became negative. Transaction costs were not taken into consideration. The system was tested for period April 2007 to November 2008, for a total of 400 trading days.s. It is worthy to note that this period also includes the great recession of October 2008, were the system achieved interesting results. For the whole period of 400 trading days, the hit rate was 58.75%, mainly due to the crisis. By breaking this period in four sub-periods of 100 observations, the hit rates achieved are 58%, 64%, 60% and 53%, respectively. During this period of 400 trading days, the WASP system made 63 transactions. This gives a rough average of 1 transaction every 6 days.

[…] case you missed out Elliott Wave Technical Analysis Report, make sure to catch up on […]
LikeLike