Machine Learning In Stock Trading: An Easy Introduction

Its holiday season. The wifey is out and what better to do than invest time in reviewing some basic application of machine learning applied to the field of Finance. This is a post I have been wanting to write for a long time. All of the Code has been written in R and is easily reproducible. I will not share it here as I dont know how to do it best. Nonetheless the most important packages for achieving this level of black magic are:

  1.  Caret
  2.  Forecast
  3.  Kenrlab
  4.  Neuralnet
  5.  Xgboost
  6.  tseries (sub to PewDiePie)

I will not be reviewing any of the statistical concepts applied but will merely focus on their application and see if we can find any viable/useful results. I feel I should not be saying this as everyon here is a mature adult. BUT this is no financial advice and you should always be doing you due diligence when investing any of your money, not taking advice from a random stranger in the Internet. And bear in mind just because a strategy has worked in the past does not mean it will work in the future.


robot


 We will be taking a closer look at the share price of the german football behemoth from the Ruhrpott who has been the eternal second after Bayern Munich, Borussia Dortmund.  As can be decuded the share price is highly related to the clubs sporting. So we shouldn’t be expecting too many conclusive results. The stock has also been known to attract some rather peculiar stories as someone bombing the team bus, hoping to hurt members of the staff to financially benefit from it. The time-seris can be seen below. As can be seen the share price has profited from some healthy growth reahcing an all-time high this year.


But how will proceed? Here a brief overview:

First we will be looking at some feature selection methods such as:

  1. Filter Methods
  2. Wrapper Methods
  3. Embedded Methods

Second we will consider multiple machine learning methods such as:

  1. Extreme Gradient Boosting Machine (XGB)
  2. Support Vector Machine (SVM)
  3. Artifical Neural Networks (ANN)

Third, we will conisder all results and compare them.

After this brief introduction we will finally get our hands dirty. First we will start by simply looking at some feature selection methods. At this point you might be thinking to yourself: “AWWW HELL NAH. JUST SHOW ME HOW TO DO THE THANG” let me tell you that feature selection is one of the most important factors when applying machine learning, so I will briefly run through it. This method consists of simply choosing input predictors. This has multiple advantages such as easy model interpretation, faster learning time, reduced dimensionality and reduced over-fitting. The principal techniques for feature selection are filter, wrapper and ensemble methods.


steveharvey


Filter methods consist of selecting input predictors based on certain statistical criteria before using them in a learning algorithm.

So first we can try to regress the returns of the share price on themselves using linear regression. Then we can trim down the input predictors down using the p-values. So we lagged the returns up to lag 9 (for no particular reason). Only lag 4 is statistically significant at the 5% level. Nonetheless we will also be looking at lag 3 as it still i statistically significant at level 10%. We have an adjusted r-squared value of 0.006 which is a rather poor result. Hence we will be eliminating all the input predictors unless the aforementioned ones.


Re-running the linear regression only using lag 3 and lag 4, we get the summary as can be seen below. As we can see re-running the test with less input predictors yields quite different results. The estimates for the single predictors are now different; furthermore, both of the estimates have become more statistically significant. Additionally the Adjusted R-squared has increased, even though still painfully low.


So we can advance to further ways of selecting our ideal predictor variables. So we can try to find our input predictors wrapper methods. The main advantage of wrappers compared to filter methods is considering interaction with output target features. The downsides of wrapper methods is obviously the increased computational power needed and the risk of over-fitting. Some of the most common Wrapper Methods are:

  • Forward selection
  • Backward elimination
  • Recursive Feature elimination

I personally use backward elimination, where we start with all the features and removes the least significant feature at each iteration which improves the performance of the model. We repeat this until no improvement is observed on removal of features.


So using the Caret package we can run this rather simply in R. By the result we can see that the ideal model is composed of four variables, which is able to minimize the mean absolute error (MAE). The lags chosen by the recursive feature selection (rfe) are 4, 5, 1, 7. The results from this little more advanced feature selection is obviously already very different from the results achieved by our simple selection method.

Last but not least we will be looking at embedded methods. These consist of selecting input predictors while using them in learning algorithms and simultaneously maximizing model performance. Embedded methods combine the qualities’ of filter and wrapper methods. It’s implemented by algorithms that have their own built-in feature selection methods. Some of the most popular examples of these methods are LASSO and RIDGE regression which have inbuilt penalization functions to reduce overfitting. I will be using the Lasso regression which performs L1 regularization which adds penalty equivalent to absolute value of the magnitude of coefficients.

Using the Lasso we get a similar result to what we had when we just used the simple linear regression model.

Now that we are done with the feature selection, we can advance to the more juicy stuff.

Going forward we will be using the 4 input predictors we obtained using the recursive feature selection. So this means that we will be using lags 1, 4, 5, 7. Furthermore we will try to run our models via pre-processing our data by using principal component analysis.

So the first machine learning tool we will be using is an Extreme Gradient Boosting (XGB), which is a very commo algorithm (seems to be the favourite from the Kaggle Nerds, joking please don’t boot my nerds). This algorithm is great for supervised learning tasks such as Regression, Classification, and Ranking. EGB has the following parameters.

  1. Tree boosting algorithm: it predicts output target feature of weighted sequentially built decision trees
  2. Algorithm optimization: it finds local optimal weight coefficients of sequentially built decision trees. For regression, gradient descent algorithm is used for locally minimizing regularized sum of squared errors function, among others.

Running the XGB in R, this is the output we get. So we notice that the number of rounds which minimized our RMSE was 50 and the max tree depth is 1. This can furthermore be observed when looking at the bottom right window, with eta 0.3 and subsample 1. What we could also try (and which I actually did) is to see whether feature extraction via PCA could improve our results.

Principal component analysis (PCA) is a statistical procedure that uses an orthogonal transformation to convert a set of observations of possibly correlated variables (entities each of which takes on various numerical values) into a set of values of linearly uncorrelated variables called principal components. This transformation is defined in such a way that the first principal component has the largest possible variance (that is, accounts for as much of the variability in the data as possible), and each succeeding component in turn has the highest variance possible under the constraint that it is orthogonal to the preceding components.

So quick check if our input predictors are in any shape or form correlated. As we can see none of the input predictors are very much correlated to each other. The most prominent correlation we can observe are at lag 5, which as a positive correlation of 0.08. In this environment using PCA makes not a lot of sense but keep in mind it is a viable tool in a highly correlated environment, such as when checking for interest rate products. Using the PCA pre-processing we finally arrive at an RMSE of 0.02720604 which is actually slightly better than the 0.02723055 RMSE achieved by selection features. Obviously in real-life you would still opt to having as little as possible input predictors. Nonetheless as the results are better and my computer is not suffering too much under the additional computational requirements we will move forward using PCA.

So moving forward, we now will visualize how our residuals behave and try to make sense of our results. Below we can see how our model behaves with respect to the actual time-series of the returns from the share price. The black line represents the actual returns whereas the red line is the estimates from our XGB. You now might be thinking to yourself: “Well this is quite underwhelming…”.

trap

Nonetheless before you rage-quit, keep in mind we want the model to give us directional predictions and not an exact estimate of exactly how much the share price will move. This is exactly what it does, we do not expect the model to reproduce the exact moves of the share, as this would simply mean that the time-series is overfit.

Taking a closer look at the results achieved by the PCA we can see that the results are very similar. Nonetheless the results achieved by pre-processing are much more prominent (simply take my word for this) .

We will now us the model to predict give us a signal and change our position in the stock. We will only consider long or no position, as shorting stocks is just a whole different story.

So when running this all we get the following table. The first column “xgbmret” describes simply the returns generated by the model. The second column “xgbmretc” describes the returns generated by the model adjusted for commissions. The commissions were calculated at 10 bps per trade, which actually cuts of fair share or annualized returns. The last column “rbr” simply is the returns generated by a long position. As we can see the model can clearly outperform a simple buy and hold position as it is able to generate higher annualized returns at a much lower risk. Nonetheless the picture changes a little when considering commissions, which place a heavy toll on the performance. When considering any sort of commission, the annualized returns drop by a total of 7 (!!!!!!)percent points. Algebraically it also makes sense that the standard deviation increases. So even though our returns have come down drastically, the Sharpe ratio is still much more performant than a simple buy and hold position.

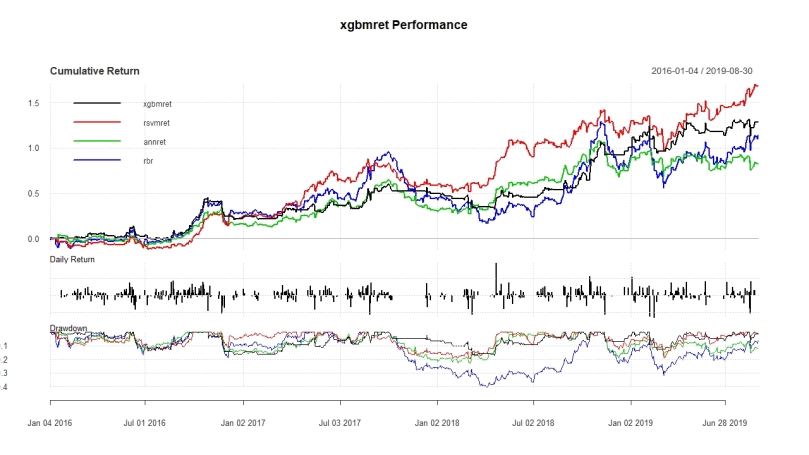
Furthermore we can check the equity curve to see how the time-series evolved over time. This is useful information as it will help us infer if any of those performances were just lucky at a certain point in time. By looking at the graph we can see that the performance was quite consistent over time. Additionally it allows to infer one of the big advantages of the model, which is the protection against drawdown which the model ensures.

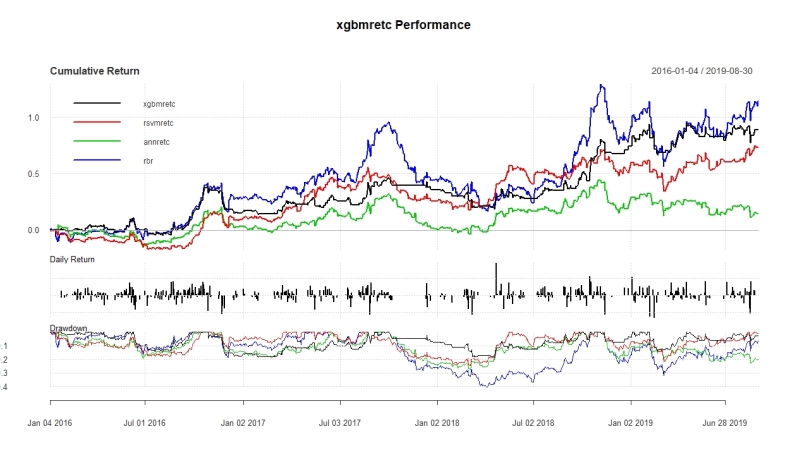
Ok now that we have tested for this model, let us try some other models. I will be proceeding in a similar way but only present you with the results and spare you all the tedious stuff in between.

So next we will be looking at Maximum Margin Methods. These methods consist of supervised boundary based learning algorithms for predicting output target feature by separating output target and input predictor features data into optimal hyper-planes. The most common method for regression learning tasks are support vector machines. Support vector machines are usually used for classification tasks which is obviously our case. Here again we will be using the pre-processed PCA time-series, again because the RMSE is lower. I will spare you most of the previously discussed details. Nonetheless I would like to guide your attention toward this graph below. This graph was already discussed when having a more detailed look at the XGB. What we can see now is that the SVM is more volatile when it comes to projections. So even though it might be more accurate but might cost us more money with respect to commissions we will have to pay.

Here again we can observe what we have observed previously. Nonetheless we can already see that one of the downfalls of the Support Vector Machine is its increased volatility which forces us to change our position many times, forcing us to pay up a lot (hey maybe the broker will send you over some goodies for that). Adjusting for commissions we have to pass on half of our earnings to the broker, which is very hefty. Considering commissions the risk-adjusted performance even becomes worse than the simple Buy and Hold position. This makes clear that it is critical for any signal to be able to blend out random noise. Even though the SVM performed much better than the XGB in an ideal world without commissions, it performed much worse when considering commissions. Now it may be that the commission I am considering is way too high or low, strongly skewing the results. This is the fine balance someone has to consider when setting up any kind of model.

And we can again observe that the trading strategy provides good protection against any sort of downside risk compared to Buy and Hold strategy.


Last but not least we will move on to the Artificial Neural Network (ANN), which is part of the Multi-Layer Perceptron Methods. Multi-layer perceptron methods consist of supervised learning algorithms for predicting output target feature by dynamically processing output target and input predictors data through multi-layer network of optimally weighted connections of nodes. The nodes are usually organised in input, hidden and output layers.

In this case we are running the ANN using the features we selected at the beginning. Just to remind you in case of short-term memory loss, these were lag 1, 4, 5, 7. The results, are to say, at the very least very underwhelming. Even though we were able to bring down the standard deviation net or not of commission the returns are just horrendously bad. This obviously does not de-classify the application of ANN, but it just shows that you don’t need the most complicated of machine learning to be able to solve problems related to finance.

So finally we can compare the results of all the algorithms and see which one performed best. When considering the results generated without considering commissions we get see that machine learning algorithms can provide valuable insights. The only machine learning algo which was not able to outperform the Buy and Hold position was the ANN. As previously mentioned the algos are able to provide some existential protection against downside risk. The retuns generated by any of the rules are anyway rather substantial.

ret_no_comm

Now ignoring commissions simply is not wise. So the returns worsen a lot when considering commissions. Nontheles we are also able to bring down Std. Dev. drastically, which is a plus. Nonetheless this is still not enough to have a better Sharpe Ratio than the benchmark.

ret_comm.jpegCapture

Is the Federal Reserve running out of time?

The Federal Reserve was steamrolled by a perfectly hedged move by the POTUS, who escalated the Chinese tariffs conflict, imposing a 10% tariff on 300 bln of Chinese goods. The POTUS and his team decided to further escalated trade wars, after a calculated move urging the FED to cut the IOER by 50 bps during the FOMC July meeting. Since then the market has rallied to long duration trades, which has led to more curve flattening and further inversion of the 3s10y TSY curve. At this point the 2y10y has still not inverted but has come under massive pressure following recent days. Even though long duration trades are not any novelty, due to the fact that financial institutions are chasing yields at every price possible, the sharp decrease in TSY is astonishing.

Generally a flattening of the curve does not mean a downfall for equities. Nonetheless such a flattening emphasizes the fear of escalating trade wars and a Federal Reserve which is not able to communicate its policy in an effective way. The risk of a market correction/downtrend have risen dramatically and market participants are slowly positioning towards a risk-off scenario, with gold slowly but surely crawling back to the levels of the GFC, trading at USD 1502 with no real profit-taking in sight. The aforementioned global tensions are reflected by equities, most notably the S&P 500, who saw a harsh and quick drawdown. The S&P ended up drawing down 205 points, losing 6.78% of its total market cap.

\\p1at.s-group.cc\0196\USERS\A96MLWA\Daten\Research\SPX.png

As of recent the distress is also felt in the interbank market with the 3M LOIS widening back to the yearly high, showing a worsening in credit. The move in credit is widely off-set by liquidity constraints, driving towards a wider the EURUSD XCCY basis. This comes as no surprise with the Treasuries decision of increasing the debt ceiling and the earlier than expected stop in balance sheet unwinding. At this moment the XCCY basis is at some sort of a sweet spot. On the one side Europe investors are looking for high yields in the U.S. zone and on the other side U.S. debt managers are looking at tendering low-yield debt. This can be observed by the growth in reverse Yankee funding.

The 5y5y forward rates on inflation levels have come down from the highs off 2.30 to well below the inflation target of 2% set forth by the Federal Reserve. This comes as an aftermath of the slowing in Economic data and the dovishness of most central banks.

The crucial factors which could impact equities are:

  1. Forward Guidance of the Central Banks: As other central banks have proceeded to react to growing worries with respect to global trade tensions, like the RBNZ who cut its rate by 50 bps the FED has come under increasing pressure. Fed Fund Futures are pricing in a total of 100 bps cuts up to December 2020. This is not observable in TSY, where the 2Y Yield is trading at 1.5978. If the Fed is unable to put markets at ease ad keeps running behind the curve we could see a correction in equities. In essence, the September FOMC could be absolutely pivotal to resetting animal spirits. The Fed has plenty of excuses to do this, trade-escalations being the primary factor, particularly as Chair Powell has consistently noted that the biggest risks to the economy are those that are external. Nonetheless compared to the rest of the globe US yields are still very attractive compared to other jurisdiction, like the German 10Y Bund who is yielding at -0,587%.
  2. Fading fiscal stimulus: With the fiscal easing under Trump, stocks saw an artificial rejuvenation. Since then fiscal stimulus has faded away and makes the comparison of companies earnings rather difficult. This phenomenon could be observed when fiscal easing began an economic surprise was very high, now with fading effects of fiscal stimulus the Citi Economic Surprise Index has been trending lower.
  3. Further Escalation in Trade Wars: In the initial rounds of tariffs President Trump raised tariffs to 25% after having levied an initial 10%. This could well become a deja-vu in the newest round of discussions, between the US and CHINA.

As observed by Citi equity markets seem to be essentially trading like a two-factor model, with the input variables Trump Tweets and FED pricing:

  1. The end of 2018 brought about more conciliatory tweets from Trump in November but crucially these were unable to prevent the equity market from correcting ~20% due to a hawkishly delivered Fed hike. An almost immediate dovish turn by Powell in conjunction with a friendly Trump tweet reversed the market sell-off at the turn of the year. At this stage, the money market curve hadn’t yet started to price cuts but did price out further hikes.
  2. By the beginning of March stocks were up 18% from the December lows, but an abysmal non-farm payrolls number spooked the money markets into pricing an entire cut by the end of the month. Ironically, this is where the “bad-data = good-news” regime emerged. Data weakness gave lower projected discount rates which helped the equity market rally back to all-time highs in May, supercharged by pacifying Trump tweets.
  3. The May escalation of trade wars started the vicious circle of the risk assets relying almost entirely on the premise of Fed cuts. The market recovered as ~70bps worth of Fed cuts were priced by June. Sentiment recovered following what looked like a temporary end to trade escalations in the G20.
  4. As of now, the Fed has disappointed the market with a ‘hawkish cut’ whilst there looks to be no sight of trade détente in the short term given the move higher in USD/CNH and the subsequent branding of China as a currency manipulator by the US Administration.

Global Macro: Outlook 2019

Introduction

The FY 2018 has nearly come to an end and heavily hit the equity markets, as most indexes look like they will close below their opening at the beginning of the year. Three factors weighted heavily on the on 2018.

  1. Transition from mid to late cycle, with central banks pulling back on years of loose monetary policy. Last time this year central bank purchases government bonds were running at a pace of $2 trillion per annum. Today the number is zero and by Q1-2019, central banks will be net sellers
  2. Economies did not match expected growth. Beginning of this year expectations were high for synchronized growth. Nonetheless this year was coined by the divergence between the U.S. growth and the disappointing growth in pretty much the rest of the world.
  3. Geopolitical conflicts took the main stage, most prolific the trade-wars and the formation of a populist movement in Italy.

null

Economic Outlook

It is written in the stars whether 2019 will be the transition year of central bank late cycle into economic recession or not. Taking a look at the deflated markets there might actually be some upside to equities in 2019. More generally, the mix of low returns and higher volatility should again be a central feature. Unlike 2018, there is a high possibility of that pockets of value in fixed income will develop, notably in front-end USD and EUR. Furthermore the strategic risk-reward is shifting away from outright selling of fixed income and into steepeners. For broader markets, the market consensus seems to be that the dollar trend will turn down, though it may not be evident early on in either the euro or the yen.

Before setting out some possible themes and trades for 2019, we will shortly revise the main macro assumptions that we will be operating under.

Growth: neutral but with a modest upside flavor. While it may not feel that way, global growth in 2018 was likely the strongest since 2014 (3.8%, up from 3.7% in 2017). The trouble is the better growth was highly skewed toward the US, and much of this year has been spent revising (mostly to the downside) forecasts in much of the rest of the world. Some of the markets consensuses, while mildly upbeat are:

  • In the US, we think strong supply side positives from the combination of deregulation and the 2018 tax reform will help sustain the recovery for longer than many think, even if we see growth slowing from 2018 levels.
  • China is as tricky and sensible as it gets. Nonetheless the belief is that policymakers are expected to avoid any slippage in growth and that they will be successful at it.
  • In the Eurozone, fiscal policy support (after years of drag) will help offset some of the external drags. Expect growth to stabilize.
  • In the UK, growth forecast have been increased to 1.9% (from 1.6%) on a benign Brexit outcome and fiscal policy boost

Inflation: contained, but with material upside risks. Despite the pick-up in wages seen in many developed economies, there is still little risk of pass-through to headline inflation. Oil will also be a net negative for headline inflation rates next year, although prices are expected to stabilize and rise very modestly in 2019.

Monetary policy: less negative, if not yet positive. Uncertainty around monetary policy is especially high heading into 2019, though on balance the headwinds should feel less fierce than in 2018. To be sure, US quantitative tightening will remain in full swing and the Fed is not expected to end its balance sheet reduction until 2020. This means central banks will be net sellers for fixed income for the first time in a year. Against this interest rate policies will be mildly dovish, on balance:

  • The FOMC will only hike twice in 2019, hence signalling a pause in the 3-year tightening cycle.
  • The ECB and BOJ will hold rates steady again.
  • The Bank of England will raises rates once in 2019 and once in 2020
  • The RBA and Riksbank join the policy normalizers; not the RBNZ

Geopolitics: a big swing factor? The geopolitical calendar in 2019 is a busy one and the risks around the key events are finely balanced. Importantly, markets have not been especially good at trading geopolitical risks in 2018 and it is hard to see why this would improve in 2019.

    • US/CHINA relation. These two countries have been at it for quite a while and there is no reason to believe that this Tango will end anytime soon.
    • Similarly no easy end to the current stalemate between the Italian Government and Brussels is to be expected. The May European Elections will be a key barometer of where integration is heading and there is no reason for optimism.
    • On BREXIT, the base case assumes a more market-friendly outcome in the next term. But uncertainty is high and longer-term risks are still significant.
    • Market Volatility

Looking back, the expected late cycle pick-up in volatility did arrive in 2018, though not always in the way envisioned. It came in a series of waves, rather than as a discrete event. Until very recently, the rise in macro implied volatility was still rather modest. And importantly, the increase in volatility was barely notable in interest rate markets. In the end, rising yields was a key driver for higher market volatility, although for the most part higher yields caused volatility shocks elsewhere, such as US equities (twice) and emerging markets.

Looking ahead, the case for a sustained period of higher volatility is still strong. Simply put, this is the time of the cycle when financial fragilities tend to be exposed. The figure below depicts a lagged measure of Fed accommodation against equity volatility (VIX). The two key takeaways are (1) Fed policy is getting closer to neutral and, given this, (2) implied volatility is likely to move higher than it is today. US equities in particular have been shielded from the macro headwinds thanks to the lingering effects of the 2017 US tax reform. But these factors will fade heading into 2019. Inevitably the mix of volatility in 2019 will be different than it was this year. This leads to the conclusion that rates volatility will play a bigger role next year as policy and economic uncertainty, inflation risks and supply begin to chip away at a prolonged period of compressed term premia and low inflation.

Steepening Curves in 2019

In the past few months the debate with regard to the relative risk rewards of USD 5s30s steepeners compared with outright selling of USD back-end rates has been intensive. The general view has been that both make sense, but as we head into 2019 the steepener trade looks the better risk-reward on the medium-run horizon. Looking ahead to 2019, with a mature, and potentially cresting, US economic expansion and the Fed reaching a potential inflection point as rates hit neutral, the year-ahead possibilities are perhaps more two-way than they have been since the immediate aftermath of the crisis. Does the expansion continue into overheat territory as the Fed stops at neutral and/or the Phillips’ curve finally starts to take hold? Do we experience a “Goldilocks” expansion period as supply-side productivity gains allow growth to continue absent inflation pressure? Or does an overly aggressive Fed, trade war, overseas risks, equity correction, or a combination of any of these or more send us into recession? In 2019 the market sentiment will swing frequently and at times wildly between all three scenarios depending on the economic and political developments. Nonetheless similarly to last year to last year there is a high conviction on the shape of the curve. This is why steepeners, more specifically 5s30s can be specifically profitable. The main arguments for this strategic approach are:

  • Fed Priced In: Since the summer, the major push back to a steepening strategy view has been that the curve always flattens in a hiking cycle, and that the current hiking cycle will continue into 2019. While certainly true, the market is largely priced for this. OIS markets are currently priced for ~2.5 more hikes by year-end 2019 (including a likely hike at this month’s FOMC meeting), which would put the Fed funds rate at the low-end of what is considered to be the Fed’s “neutral” zone. On the curve, end of 2019 forwards are still priced for 2s10s at ~20bps and 5s30s at ~35bps. In addition, if one looks at the 2004-2006 hiking cycle, the curve flattening hit its trough in February 2006, about 4/5s of the way through the cycle with 4 months and 3 hikes left to go. From the start of the hiking cycle, to February 2006, 5s30s flattened by ~170bps. Over the last four months of the hiking cycle (which saw another 75bps of hikes) 5s30s actually steepened by a little over 20bps.


  • Term Premium: The belief is that in 2019, we will see term premium injected back into the Treasury market. Since the 1970s, term premium has, in our view, been on a long-term downward trend due to increased central bank transparency and credibility, culminating in post-crisis forward guidance and a secular move lower in the uncertainty related to both monetary policy and economic data. However, as the chart below shows (plotted from 1990), within that long term decline, term premium bottoms into or near the first Fed rate cut of a cycle, with the notable exception being the Taper Tantrum. The belief is that we may be at or near that part of the rate cycle, even if we aren’t necessarily forecasting a turn towards recession in 2019. But with market participants increasingly split over the near- to medium-term direction of the economy and markets (overheating/Goldilocks/recession), investors will need to be compensated for rising two-way risk, pushing term premium higher. Additionally, as the Fed moves towards data dependence, and away from forward guidance, central bank transparency will decline and the range of potential Fed outcomes should widen. Term premium should rise on this basis alone.

  • Volatility: While it is not clear which leads, term premium and implied volatility tend to move together. Conceptually, both implied volatility and term premium can be interpreted as investor compensation for uncertainty. To that end, increasing uncertainty, as discussed in the prior bullet, should lead to higher volatility, something we have already seen in FX and equity markets. In 2019, higher rate volatility as well, additionally supported by slower growth in the US and, in some cases, the slowing expansion of, or outright decline in, central bank balance sheets are to be expected.


  • Supply: In the long end, markets should remain concerned about increasing Treasury supply, as the Treasury is expected to take a pause on increasing nominal auction sizes at some point in 2019. Nonetheless the market could interpret such a pause as a “pullback” in supply, and in turn bullish for rates. But Treasury’s monthly gross coupon issuance will still be significantly higher than it was at the beginning of 2018 – meaning that even if Treasury pauses or slows the increases in auction sizes for some time, the amount of outstanding Treasury debt will still be growing at a rapid pace. Importantly, these headwinds are apparent even though no major fiscal policy expansion is expected in 2019, given Congressional gridlock. The expectation is that the growth in outstanding Treasury debt weighs most heavily on the back-end. Thus far, from a par perspective, Treasury has increased front-end auction sizes the most. But when taking into account duration, and the maturity/rolldown profile of existing Treasury debt held by the public (ex-Fed), the back-end will be growing at a faster pace than other sectors. For example, by the end of 2020, the size of the 10- to 30-year sector that is held by the public is expected to grow by ~58% since the beginning of 2018.
  • Demand: In addition, there are reasons to remain very concerned about foreign demand for the Treasury market, particularly in the context of rising supply. This concern is especially focused at the long end, where foreign investors are already infrequent buyers of 30yr Treasury bonds (since January 2016, foreign investors have bought an average of 9.5% of 30yr bonds at auction). But, with both prohibitive hedging costs and questions about the durability of the USD rally into 2019, foreign demand will be tepid across the curve going forward, at a time the supply outlook means the US needs additional buyers more than ever.

In sum, the front end of the US curve is already priced for additional Fed action from here on. Supply and demand dynamics, along with the possibility of term premium returning, point to a steepening bias in 2019. The expression of this could be a 5s30s curve, given the view that the long-end will be more impacted by supply and looks even less attractive to foreign buyers.

Italy and Europe

2019 is likely to be another year dominated by politics in Europe, and politics will be dominated by Italy, as every widening in BTPs, every interaction with the Commission, and every political event will be seen as a de-escalation, or a step toward the Italexit event horizon. Markets are already very pessimistic, nonetheless the direction of travel is toward greater pessimism and wider spreads – too much can go wrong between now and European elections, which will be seen largely as a trial run for Italian elections. Nonetheless concerns about a 2012-style contagion seem low.

With no surprise most market participants have been short BTPs. For those looking for proxies with better carry: short EUR FX (vs CHF or JPY), long EUR FX volatility, short Austria, long Schatz.

Euro Exit = (Crisis + Euroscepticism)

One thing is certain: a country leaving the euro will only do so in the midst of a crisis, supercharged by capital flight. But would the decision to leave be the cause of that crisis or the response to it? The concern is, of course, that the process is non-linear; that a country might be sucked increasingly quickly toward a point of no-return, as economic pain, Euroscepticism, and capital flight feed on each other. Italy is the only country in Europe where such a process looks like it could gather speed in the near future. It is not in crisis now, but shocks are unpredictable, it is already relatively Eurosceptic, and markets are on edge. Of course, if a level of crisis is a necessary condition to set such a circle in motion, a crisis in Italy could easily become a crisis in other countries too. We look at contagion risks below because Euro break up is not only a BTP theme. It has been the major theme of 2018, and looks likely to be the major theme for European markets again in 2019.

How much bad news is in the price?

An approach to this framework is to directly look at the probabilities of Italexit and possible losses given default. The table below shows that markets attribute Italexit a probability of 30-40% in the next ten years, depending on the LGD on the BTPs ( compared to an alternative of holding bunds).

A guide to anticipating an Italian crisis in 2019

But what about the tactics, if you’re interested in direction of travel? There are no great secrets here. Trying to think in a possible escalation sequence, some of the accelerators to have in mind include:

BTP idiosyncratic risks. BTPs do not just reflect expectations. They have real effects. Wider spreads feed into broad financial conditions, are constantly commented in the press, and tempt politicians to blame Eurocrats for weaponising the markets against them. BTP idiosyncratic risks are the most likely early crisis-accelerators, in particular:

  • A failed BTP auction or a poor syndication could quickly turn uncertainty into something much more serious. The new government entered in late May, and has enjoyed lighter H2 supply so far. This is expected to step up in January.
  • Ratings downgrades are likely in 2019. Fitch and S&P did not move this year, although S&P downgraded its outlook to negative in October. Italy is two notches above ‘junk’ with these two, while the buffer is just one notch with Moody’s. The next reviews may be around March. A downgrade to a middle rating below BBB-would risk unlocking substantial selling, especially of the ~€630bn of BTPs held abroad.

Debt sustainability concerns. There is no magic level where markets might start to worry about the long-term affordability of Italy’s debt. The chart above illustrate that debt sustainability is not at the core of any budding crisis at this point. Italy rolls about 15% of its debt every year, so the average cost of financing does not rise exceptionally quickly even if markets demand higher yields in a challenging year.

Government ‘reaction function’ to market/economic stress. Finance minister, Giovanni Tria, indicated that 400bp in 10y BTP/bund spreads might be a level where action would be taken to reduce pressure on financial conditions. Although that does not imply budget cuts, markets might expect something in that direction if that level were tested. Conversely, if nothing were done, confidence could leak away quickly. Mr Tria has also recently assured markets that there is a ‘safeguard cushion’ to guard against budget slippage if growth disappoints and that 2.4% is a ‘maximum ceiling’. The way this is spelled out in a final law could be important for restoring Mr Tria and Italy’s credibility with markets.

Global/European growth. External demand is important for Italy: export demand adds up to 26% of GDP. Slower growth increases the likelihood of budget slippage, confrontation with the Commission, and ultimately Italian sentiment toward Europe and the Establishment. The debt sustainability analyses that show debt/GDP continuing to fall in coming years rely on some economic growth.

European elections… Salvini’s League and the French Front National explicitly intend to sit together in the European Parliament, and others could switch from current formations to join them. It is unlikely that ‘Eurosceptics’ would be able to form the largest bloc. But they may be significant enough to present a serious challenge to the European order, making further progress on reforms to strengthen European contagion firewalls and financial stability almost unthinkable.

… and European elections as warm-up act to Italian elections. New elections are likely in Italy in 2019, especially if a right/centre-right coalition can sustain 45% or more in the polls. The European Parliament campaign will be a key test of how far the League and M5S will try to develop and exploit eurosceptic feeling, and their results will be a vital test of how successfully such strategies might be carried into national elections.

In/out referendum. The end game for Italexit would almost certainly involve a referendum, if a government does not wish to be accused of staging a coup. In Italy, a binding referendum on an international treaty is unconstitutional (article 75). A non-binding advisory referendum would be possible, however (the vote on EEC membership in 1989 is a precedent). Greece’s 2015 bailout referendum, which was eventually ignored, and the UK’s 2016 Brexit referendum, which was not, were both non-binding. A promise to present a referendum would dramatically raise risks in the short-term.

Italexit as campaign pledge? Could we jump straight to the end game like this? Unless elections were held in deep economic crisis, this is surely highly unlikely. Could it just be good tactics for a politician who has already concluded that leaving is in the national interest to try to accelerate the agenda by causing a crisis? This is far-fetched. A risky policy is more likely to cause trouble the more markets think you will be in a position to carry it out. But the more likely you are to win, the less you will want to cause trouble that may just complicate things for you. Although Mr Salvini enjoyed campaigning in a ‘Basta Euro’ t-shirt in 2017, that was before he became the leader of the centre-right and serious contender to be next prime minister.

What about crisis-brakes?

Investor risk appetite. As with any positive carry trade, BTPs are expected to tighten if the risks outlined simply fail to emerge. This would naturally put the crisis- Euroscepticism spiral into reverse.

TLTRO-iii. The ECB will probably have to offer long-term funding to guard against worsening in financial conditions in Italy, and to replace TLTRO-ii money before it slips below one year maturity. Markets expect an announcement in March or April and tender in June. This may encourage carry trading, at least short-term in short-dated paper. It is possible that the ECB will design incentives carefully to encourage banks to behave as it would like them to, which, if effective, may discourage sovereign carry trades.

Early elections. Early (H1) elections are unlikely, but could raise the possibility of a right/centre-right coalition to replace the populist coalition. This may be welcomed by markets because it would concentrate accountability and replace the M5S with partners perceived as more business-friendly and less eager to raise spending.

Contagion

Interlinkages: Opacity, Bubbles, Finance, trade, and the Eurosystem. It is worth recalling that contagion in the Subprime Crisis and the Sovereign Crisis alike was rife largely due strong but opaque financial-sector interlinkages. Asset price bubbles and private leverage were a key vulnerability, especially in Spain. Spanish households and firms have cut debt by over 60pp of GDP since 2010?

i) Finance. Even though the ECB has made an effort to buy back most of the Italian debt, markets will seek out direct financial interlinkages most quickly. Spain and France are the most exposed. Total portfolio and FDI exposures sum to around 8% of GDP in both cases. As a cross check, the BIS puts French banks’ consolidated exposures to Italy at €270bn (11% of GDP). But a large part of this will be due to local claims of separately capitalised and funded subsidiaries such as BNL and Cariparma. Consolidated claims of Spanish banks on Italy are 5% of GDP.

ii) Trade. Italy as a consumer market for a remaining EMU would clearly suffer in Italexit. Total exports to Italy from other EMU countries, of which only a proportion will represent final demand, are around €175bn (1.7% of GDP). The most exposed countries are The Netherlands (3.3%), followed by Germany and Spain (2%). A competitive devaluation in the case of Italexit would risk stealing market share from other EMU countries across industries, but might be fought against via trade policy.

iii) Eurosystem holdings. BTPs held by the ECB and Eurosystem are probably not big enough to be systemic. Europe’s ‘big’ exposure to Italy is the Target 2 balance (€489bn in September, see sidebar). We assume that in any break-up, the ECB would be able to monetize a loss in such a way that this would not become a systemic problem.

Firewalls: ECB OMT, PSPP, and the ESM

If Italy finds itself under pressure but does not want to leave the Euro, OMT and the ESM are almost certainly enough to cope. Italexit is a risk only if the strings attached are unconscionable. The key question, therefore, is whether firewalls are large enough to protect the rest of the currency area from Italexit contagion.

National budgets. The first line of defence would be the national budgets. The commission will surely allow significant forbearance in the surveillance process for such an event and cross-border exposures are not so large that it is clear the cost of an Italexit crisis would push debt/GDP to levels where markets would cease to finance. Portugal is a possible exception, but its direct exposure to Italy is relatively low.

ECB PSPP/OMT, and ESM. If this is too sanguine, in such a crisis, the ECB could use its deep pockets to support in several ways. Indirectly, re-starting quantitative easing would be very likely to be justified by the inevitable deterioration in economic conditions. In principle there is little doubt about the capacity of OMT to smooth through any Italexit turmoil together with the ESM, whose €400bn lending capacity is prima facie more than enough to guard against Italexit contagion, even allowing that this headline figure would be reduced due to questions over some of its major shareholders in a crisis. The fly in the ointment is both OMT and ESM support would require an ESM programme to be approved. Italy, with its 17.8% of ESM voting rights could veto any such programme and may find that it is in its strategic interest to threaten maximum disruption in any exit process.

Trading Italexit

Short BTPs. There is a near-term upside risk for BTPs because November has been a hard month, while in December PSPP flows are friendly and political risk may quiet down. But into next year the high probability of too many of the risks listed above materialising to be sanguine. In particular, we do not expect the budget to embed any formal brakes. Economic downturn makes budget slippage likely. A spiral of escalation between a hardline Commission and scapegoating by the government is foreseeable, which could heighten tensions into the European Parliament elections, where we expect populist-nationalists to perform well.

Trade recommendation: Short 10y BTPs vs 10y Germany at 287bp. Target 400bp. Stop at 265bp. Carry and roll down to be short is -20bp/month.

Top contagion trade? Short EUR FX, long EUR FX volatility, Short Austria, long Schatz. The multi-asset screener (published by Deutsche Bank) below highlights possible value in banks and periphery as lower-carry trades to proxy a short BTP view. Iberia and banks look like they might be susceptible to some catch-up with BTP spreads.

Where the cost of a short is the cost of carry, it is natural to consider this the ‘premium for an option on Italexit escalation’, and we can work out a ‘payout ratio’ for a terminal scenario to compare them. A number of flight-to-quality trades are likely to benefit from Italexit and offer positive carry or flat carry, however.

  • Benchmark: short BTPs. 10y BTPs carry and roll around 15bp per quarter negative (to be short). With BTPs at 308bp this gives a scenario payout ratio of 11.5x.
  • The best contagion trades are in currencies. In particular, short EUR against risk-off currencies such as CHF and JPY, although long USDEUR should also work and it is a trade you are paid to hold.

6. Brexit – Deal or no Deal?

For all that is known, the Brexit has been discussed from all angles possible. In their current form, the proposed Withdrawal Treaty (WT) and Future Framework (FF) political declaration suggest a ‘softer’ Brexit outcome relative to current market pricing. Any extended transition period (into 2022, say) – where the UK has left the EU but retains status quo access to the Single European Market (SEM) – would further reinforce this, even if the eventual long-run economic settlement is more accurately depicted as a ‘harder’ Brexit. Some of the favourite trades (with fat-tails payoff) are:

Trade 1: pay Nov2019 SONIA, more risk inclined investors may want to add paying Feb19 SONIA

November 2019 MPC-dated SONIA only discounts 21bp of rate hikes. It seems a very strong view that the MPC will hike if they have resolution of Brexit in a pro-risk manner, and whereas markets call has previously been May 2019 for the next hike, there is every prospect of February being the date. Given there is just 4bp discounted in February 2019, this is good risk/reward as a pay.

Paying November 2019 SONIA, discounting 21bp of hikes, seems an even safer way to play this, and will still profit from any February move (which surely will see a full extra hike discounted in 2019). A May hike will still see this make ~20bp profit.

Trade 2: 3s20s flatteners in Gilts

3-yr Gilts are the richest point on the curve, trading around the repo rate already (0.75%), which is itself set to rise on resolution amid markets revising up growth forecasts. In the absence of global recession this value is just not justified, and this as a stringent global growth bearish author. Moreover, 3-yr Gilts are not eligible for the 2019 buybacks that occur (the BoE will only buy Gilts > 3 years to maturity). The biggest redemption in the next three years occurs in March, and the BoE cash holding of £20.6bn will be immediately reinvested via QE of a likely £3bn/week (our trading desk estimate). This QE is very important to note in a world which is tightening liquidity conditions (eg the US balance sheet is shrinking), and a reason our shorts vs Europe are at the front end and not along the curve.

Meanwhile, 20y rolls better than 30y, and in buyback scenario analysis in past years has been shown to be a strong performer when buybacks are ongoing. Long 20y carries & rolls marginally better than 30y, so at the margin is a better long point, especially when we see global forces steepening up 10s30s curves in Europe, US and Japan – if possible we will avoid the 30y point. This costs 0.7bp/3m carry and roll to run.

Trade 3: pay 1y1y UK inflation at all-time highs. A 100bp home run trade

Trades like these they do not appear to often and those seeking them just pay away premia for events that do not transpire. The newest possible home run trade could be a 100bp mover. Pay 1y1y inflation in the UK at 3.74%. This looks strong risk/reward. It trades more or less at an all-time high and has recently spiked as markets have become wary of a ‘risk off’ Brexit. This is just WRONG. And shows that the memory of the market is too short. Inflation is peaking in the UK anyway, economist forecasts a peak in next two months of 3.4%yoy, before gently gliding down to 3.0% at the end of 2019. Moreover, no demons are predicted in the data, with another 3.0%yoy forecast for 2020. I submit that if we are at 3% on a gentle glide down all summer/autumn, which makes for falling inflation volatility, markets will not price 1y1y inflation much above 3%, and perhaps a bit lower. A target of 3% would mean 75bp value, and a move to 2.75% would unlock 100bp of value. It is rare to suggest that there is 100bp of value in anything (unless making a major call such as short credit as big macro theme). There is one major mistake the markets are making, namely that a harder Brexit is risk off and means weaker FX and higher CPI. It does not. Yes, import prices will rise as FX falls, but corporates will be the buffer to the consumer, because we will be in recession conditions. In 1992, the pound ended its ill-fated membership of the Exchange Rate Mechanism. The 16% fall in trade-weighted sterling led a consensus calling for inflation to take off. Markets called this 100% wrong, because the UK was coming out of recession and there was no ability to pass through the import price rises. UK RPI dropped from 4% in summer 1992 to 3.2% by end 1992 and troughed at 1.2% in mid 1993. Crushed. It is extremely unlikely to be any different now. A hard Brexit scenario and big fall in £ is surely associated with weaker growth – our call is recession on no deal/hard Brexit. As such, we have a glorious opportunity to fade everyone who has put 2 and 2 together and got 5, without looking at the underlying economy, and just looking at a normal import prices vs CPI chart, which in any NORMAL circumstances will be well correlated.

FX trades: Sterling – risk premium to be squeezed

The evolution of relative Brexit outcome probabilities in the latter part of November – a greater likelihood of a ‘softer’ Brexit outcome (a WT with an extended transition period or a ‘remain’ vote) vs a ‘harder’ Brexit outcome (No Deal or a revised, minimalist Eurosceptic WT) – suggest Sterling valuations should be higher.

Fundamentally, Sterling has been seen through the lens of the risk premium, which in turn is almost solely a function of uncertainty. With more uncertainty, the greater the risk premium and the weaker Sterling has become. For sure, uncertainty is extremely high. But, at some point, valuations will reflect a probabilistic model of outcomes. This is where the value lies in owning Sterling.

A greater likelihood of “remain” or a “soft-Brexit” outcome and a much reduced chance of “no deal” Brexit suggest Sterling valuations should be higher; potentially considerably higher. Reduced uncertainty can also see a greater focus on a much-improved twin deficit metrics and possible BoE rate hikes.

This leaves low delta GBP/USD calls in a favourable position. In spot we forecast for a change in Sterling sentiment as uncertainty declines, through short EUR/GBP and long GBP/CAD positions. The latter position chimes with our core North American theme of late cycle policy tightening and ebbing growth. EUR/GBP reflects our expectation that political risks will shift to the Euro area in ’19 and ECB policy normalisation is delayed.

Trade 4: Short EUR/GBP | Target 0.84, Stop 0.9150. Spot reference 0.8890

Trade 5: Long GBP/CAD | Target 1.8450, Stop 1.6350. Spot reference 1.6940

Trade 6: GBP/USD 6 Month 1.50 Digital Call = 4.0% (spot ref) 1.2828

The asymmetric (upside) risks to inflation

While the base case is no meaningful pick-up in inflation in 2019, risks are skewed to the upside when markets are not pricing much change. Late cycle pick up in wage growth and an easing in fiscal policy just as economies reach full employment. At the secular level, the combination of populism and trade protectionism is inflationary, all else equal. Possible volatility trades could be 5y5y USD BEIs, SPGBei23s and 10y10y USD volatility.

In most countries, inflation has consistently come in below forecasts from analysts and, more importantly, central banks – on balance. 2018 was no exception (see figure below). The bias on inflation has also made markets more inclined to be bullish bonds, with the US a key exception last year. Economists are again calling for a generally tame outcome for inflation in 2019. While US core inflation is expected to remain above the Fed’s forecast there is no case for any further acceleration. Cyclical and secular forces of disinflation are weakening

That said, we can’t help but think the risks around the inflation base case are significantly skewed to the upside. The reason is that many of the cyclical and secular forces of low inflation are under threat. Importantly, markets are not priced for much deviation from this low and stable inflation equilibrium. In the US for instance, both 10y term premia and interest rate volatility are at or very near record lows dating back to the 1960s. Inflation markets seem equally unfazed judging from most breakeven inflation curves.

So just what are these forces of disinflation that are beginning to turn? Let’s start with the cyclical drivers:

  • The G10 unemployment rate is currently at its lowest level since 1974. It is hard to know what the right “full employment” level is and there are measures such as the employment-to-population ratio in the US which imply labour markets are less tight than they seem. Still, from its peak in 2010 of 8.1%), G10 unemployment has been falling by nearly 0.5% per year, the fastest, most persistent decline in unemployment since the 1960s.
  • More compellingly, there are signs of stronger wage growth in many advanced economies. The BIS Global Wage Heat Map below shows the general trend in wages has been mostly up in 2018. Indeed, as we look back on this year, this broad-based improvement in wages is surely high on the list of potentially important and certainly surprising (to many) macro trends.

  • Fiscal policy is turning more growth supportive – at a very late stage of the business cycle. Naturally, much of the focus of fiscal policy has been on the US. Indeed, today’s gap between the unemployment rate and the budget deficit has only been repeated once in post WWII history, in the late 1960s. Ironically, that was a similar period of inflation complacency. But the tilt toward easy fiscal policy (and away from easy monetary policy) is not just a US phenomenon. The swing from fiscal tightening to loosening in Italy will be more than 1% of GDP. In the UK the figure is close to 0.7%. Even Germany is expected to loosen fiscal policy in 2019.

A few trades that look interesting to take advantage of these asymmetric risks include:

  1. Buy USD 10y10y volatility. Very attractive valuations, cheap carry and less supply of vega in 2019 make this trade good risk reward.
  2. Buy US 5y5y inflation either via TIPS breakeven or inflation swaps: attractive entry levels, a stabilization in oil prices and increased supply in 2019 imply good risk-reward for positioning for upside inflation risks.
  3. Buy SPGBei23s at 91bp on breakeven. Target 135bp. Six-month roll and carry is approximately +12bp at trend inflation of 1.2%.

Global EM: long deficit high yielders vs. short commodity low yielders

In 2019, trading global EM FX will be about the balance between the expected flow of global savings and the nature of synchronised global growth. Savings are expected to ‘Crowd In’ to high carry EM deficit countries once the market recognises that US growth is rewarding savings less for funding the US twin deficit. Synchronised global growth to continue to unwind, which would leave us bearish on lower carry EM countries which are exposed to manufacturing and commodities is expected. In CEEMEA long TRY/ZAR, in LatAm long BRL/CLP and in Asia long IDR/CNH.

The story of 2018 for EM was a liquidity shock driven by US fiscal issuance (Crowding Out) and the Fed’s Quantitative Tightening (The Portfolio Balance Channel). According to Jim McCormick current account, real policy rate and REER buffers mean that EM can now absorb those shocks better than in the past. EM now offers better protection and compensation for deteriorating global liquidity. Counterintuitively, ‘Crowding In’ implies global savings will favour EM deficit countries. EMs most dependent on capital imports will actually attract most capital because of valuations and growth potential vs. commodity EM. $463bn of net global savings will seek the best expected relative return. Peak US growth in combination with cheap EM assets means the US twin deficits will struggle for funding relative to the rest of the world. Synchronised global growth will likely continue to unwind in 2019, as global growth decelerates from 3.8% to 3.6%.

The key point to make there is that last year two thirds of the improvement in global growth came from the commodity producing economies across G10 and EM. The boom was highly commodity and manufacturing intensive, so the slowdown will likely see those economies suffer more on a relative basis. CNH shows high manufacturing (29%) and Global Value Chain (48%) exposure, while CLP and ZAR have high commodity exposure (68% and 44% respectively). So we go short those on RV.

At the same time as the housing, capex, manufacturing and auto data have softened in the US, aggregate EM fundamentals have fared relatively well, with EM return on equity and profit margins rising to 12.7% and 9.9% respectively (left chart below). This pushes the ‘Crowding In’ theme further, especially with EM equities looking relatively cheap having underperformed developed markets by 19% this year.

Taking a relative value EM approach is key as global risk assets are still vulnerable, including credit and equity. Risk assets contend with peak global earnings growth (now ~17% from ~21% February), scarce global QE flow excluding reinvestments and wage growth eating into the profit share. Therefore a suggestion would be to hedge long TRY, BRL and IDR exposure with short ZAR, CLP and CNH.

Cross Asset Valuation Snapshot

A year-ahead process is never complete without a lens on long-term value. Some key points:

1) Equities are not that rich when you look outside the US

The expensiveness of US equities has been a key discussion point for some time. This year did see some de-rating of the S&P, but it still looks rich. Other developed markets are also in the expensive zone, if not notably. Against this, many EM markets look cheap, especially compared with bubble-like levels in 2008. India is an exception.

2) European fixed income is expensive, EM is cheap, US is “fair”

European fixed income remains very rich on a real yield basis. US real yields are now firmly positive, which will be important as uncertainty builds. Many high-yield EM markets now offer decent value for fixed income investors. Turkey FI looks expensive, but only if current high inflation levels are sustained.

3) The CNY is still expensive while the US dollar is getting there

Despite the 6% drop in the CNY basket in 2018 the currency remains expensive from a longer-term perspective. The US dollar is also getting expensive, if not yet notably so. Against this, the Turkish lira is the cheapest currency, a significant turn compared to early 2018. The yen is also very cheap on a longer-term basis, although it may need some movement from the BOJ to change this.

4) Credit: expensive, but some value in EM

DM credit looks universally expensive, especially when compared to equity. EM credit looks better value, Mexico and Turkey especially.

5) Housing markets remain very expensive in small open economies

The balance between low inflation and high house prices remains an issue for many small open economies. Canada and Norway have started raising rates despite some housing stress. We’d expect Sweden to follow suit in December and Australia in 2019.

Tax reform inspires Wall Street

European stocks rallied strongly on Monday after the U.S. Senate passed a tax package delivering significant fiscal stimulus, which investors have been anticipating would give extra legs to the bull run in equity markets. The U.S. Senate voted in the early morning hours on Saturday to pass the tax reform bill. Wall Street is most excited about the provision to lower the corporate tax rate from 35% to 20%, which it expects would be a boon to Corporate America and a positive for an already historically high stock market. The tax overhaul delivered some relief in early European trading after benchmarks hit multi-week lows on Friday. Strong gains in the U.S. dollar helped Germany’s dollar-exposed DAX shoot up from a two-month low, last up 1.1 percent. The euro’s strengthening has weighed on earnings expectations for stocks across the euro zone this quarter. The Dax decided to ram the doors open on the first trading day of the week, hammering the 13’040 mark at opening and ramping up to the 13106 point mark booking a 1,95% increase. One hour before opening the German DAX is only quoting positive returns with the biggest Loser being ProSiebenSat1 increasing its market cap by 0,15%. The biggest Winner on the German Index is Fresenius Medical Care KGaA. After opening at 84 Euro, the stock rose to a half-year high at 87,18 Euro and is now quoting at 86,84.

The most recent five-day stretch of trading on Wall Street was an exciting one for those long equities. For starters, the Dow Jones Industrial Average used a couple of notable advances to blow past the 24,000 mark. On Friday, it was a rollercoaster ride for the investment community, with some sharp reversals in the direction of trading during the seesaw session. In addition to the tax reform hopes, trading was driven by the decision of General Michael Flynn to plead guilty to a lesser charge in Federal Court, which many pundits think will have him talk about the Trump Administration’s alleged dealings with Russia. The Flynn news spooked the market after a strong start to the session, but the losses were pared significantly into the closing bell when it was looking more likely that Senate Republicans would have enough votes to pass its tax reform plan. For the day, the Dow Jones Industrial Average, the NASDAQ, and the broader S&P 500 Index were down 41, 26, and five points, respectively. The small and mid-cap sectors also finished lower, but it was not a clean sweep for the bears, as there were more winning than losing stocks on the Big Board. Most of the damage was done by the NASDAQ, where decliners outnumbered advancers by a comfortable margin. The industrial and technology sectors were the notable laggards, while the energy group was very much in favor. The remaining groups among the 10 major equity groups did not finish the session too far removed from the neutral line. Notwithstanding Friday’s setback, the equity market entered the final month of 2017 with a chance to make history. If the major equity averages were to finish the 31-day stretch in positive territory, it would be the first time since the inception of the stock market that it finished higher during each month of the year. The bulls will certainly be emboldened if Congress can get a tax reform bill on President Trump’s desk for him to sign into law before year’s end. Too, there could be another Santa Claus rally on the horizon, especially with a strengthening U.S. economy making a case for investors to put more money into stocks. The investment community also seems to have already factored into its valuations the likelihood the Federal Reserve will tighten the monetary reins by 25 basis points at it two-day monetary policy meeting next

Investors will begin the first full trading week of December with some M&A news. The lead headline is the agreement in place for pharmacy giant CVS Health to acquire insurance provider Aetna. Under the terms of the $69 billion deal, which may reshape American health care, Aetna shareholders would receive approximately $207 per share, consisting of $145 per share in cash and 0.8378 of share of CVS stock for each share held. Meantime, reports surfaced that Broadcom plans a hostile takeover of Qualcomm after the latter rebuked past attempts to work out a deal between the two technology giants. Specifically, Broadcom now plans to nominate a slate of 11 independent members to the board of Qualcomm after the semiconductor company rejected its $103 billion cash-and-stock bid last month.

On Monday Morning the Dow Jones is rallying up at 24522 point after breaking the 24000 point mark on Friday. Some of the biggest gainers included bank and industrial stocks. Bank of America and JPMorgan rose more than 3 percent, while Caterpillar and Boeing  gained about 2 percent. One hour after opening the Index has gained 280 points.


Bulls drive Dow Jones to the 24000 mark

Today’s Overview:

  • Dax crashes
  • Dow Jones breaks the 24000 mark
  • CFIUS clears Bayer’s planned takeover of Monsanto
  • Tesla opens biggest Lithium battery factory
  • Juniper goes crashing after Nokia denies take-over

After a long week with no real changes the German DAX seems to be heading down in the first day of December. After opening at 13044, the German Index is down at the12854 point mark, losing 130 bp. The DAX is not the only Index suffering in the first day of December. The euro zone is sliding down Overall on the last day of the week as euro zone factories posted their busiest month in over 17 years in November. At mid-day only 3 stocks are above the 0% line, the biggest loser being Infineon carrying a loss of 228bp. Europe’s financial stocks wilted after a delayed vote on tax reform in the U.S. deflated a rally in the sector, driving regional benchmarks to start December with a dip. Euro zone stocks fell 0.6 percent while Britain’s FTSE, which has suffered from a strong sterling this week, slid 0.1 percent.  Financials were the biggest weight after the U.S. Senate delayed a vote on a tax reform bill that investors anticipate will be beneficial for banks.  Lloyds, Barclays, and BNP Paribas led the index down.  Oil and gas stocks stayed buoyant, with Shell, Total and BP leading sector gains as OPEC’s extension of supply cuts continued to boost crude prices. Healthcare stocks outperformed thanks to a Morgan Stanley upgrade boosting UCB by 3.3 percent while Novo Nordisk, flagged as one of the strategists’ favourites in the pharma space, gained 2.8 percent.  British pharma company Indivior also shot up 11.7 percent after its opioid addiction drug got approved by the U.S. Food and Drug Administration.

In the U.S. the stock market delivered a strong performance yesterday, with traders seeming to be more confident that the Trump Administration’s tax plan will be approved. At the close of trading, the Dow Jones Industrial Average was ahead 332 points; the broader S&P 500 Index was up 21 points; and the NASDAQ was higher by 50 points. Market breadth was supportive, with winners nicely ahead of losers on the NYSE. Most equity sectors participated in today’s advance. The energy and industrial issues showed leadership, while the telecom names and utility stocks underperformed. Technically, the stock market continues to move strongly higher, with the Dow Jones Industrial Average now past the 24,000 mark. While equity valuations are elevated, traders seem content with the nation’s economic progress.

On other big news Germany’s Bayer said that the Committee on Foreign Investment in the United States (CFIUS) had no national security concerns about the drugmaker’s planned takeover of U.S. seeds group Monsanto, giving its go-ahead. Bayer and Monsanto will continue to cooperate with other authorities to complete the transaction in early 2018, Bayer said in a statement on Friday.

Tesla Inc switched on the world’s biggest lithium ion battery on Friday in time to feed Australia’s shaky power grid for the first day of summer, meeting a promise by Elon Musk to build it in 100 days or give it free. “South Australia is now leading the world in dispatchable renewable energy,” state Premier Jay Weatherill said at the official launch at the Hornsdale wind farm, owned by private French firm Neoen.  Tesla won a bid in July to build the 129-megawatt hour battery for South Australia, which expanded in wind power far quicker than the rest of the country, but has suffered a string of blackouts over the past 18 months. In a politically charged debate, opponents of the state’s renewables push have argued that the battery is a “Hollywood solution” in a country that still relies on fossil fuels, mainly coal, for two-thirds of its electricity.  Supporters, however, say it will help stabilize the grid in a state that now gets more than 40 percent of its electricity from wind energy, but needs help when the wind dies down.

Shares of Juniper Networks Inc fell 8 percent in pre-market trade on Thursday after Finland’s Nokia denied reports that it was in talks to buy the U.S. network gear maker.  CNBC on Wednesday reported, citing sources, that Nokia was in talks to buy Juniper at an offer that would value the company at around $16 billion, higher than Juniper’s $11.26 billion market capitalization as of Wednesday’s close. That valuation would imply a price of about $42 per share, a level last seen by Juniper shareholders six years ago, Morningstar analyst Ilya Kundozerov wrote in a client note.  Within hours of the CNBC report, however, Nokia, which does not typically comment on market rumors, said it was not preparing an offer for Juniper. Bernstein analyst Pierre Ferragu said Nokia acquiring Juniper seemed a stretch citing an operational alliance limited to $300 million to $400 million in costs, near impossible product integration in routing and a risk of negative revenue combination.


Volkswagen up 12% MoM

Today’s Topic:

  • Bulls take over the Markets
  • Volkswagen up 12% MoM
  • Uber grows its debt

Opening at the 13’156 point mark the German Index advanced to 13’200 point mark in the afternoon and follows the general trend on the Markets. Just before close only 4 stocks ( Infineon, SAP; Fresenius and Vonovia) are quoting negative ticks. The markets have profited from the tax reform advancements and couldn’t even be shaken by the nuclear missile test in North-Korea. Volkswagen takes the spot number one for the second time in a week with a 3% increase. The German carmaker went from 172,75 Euro to 175,75 Euro and is up 12% on a MoM comparison. Volkswagens Price jumped as a reaction to the 3,82 percent increase in Sales. “All brands have most recently developed strongly,” Mueller (Volkswagen CEO) said on Wednesday at a staff gathering in Wolfsburg. “And I trust that also the two remaining months will confirm the strong trend. And that we will be able to finish the year 2017 on a new record.”

After limping into the post-Thanksgiving weekend session with a mixed-to-lower showing on Monday, the bulls had the momentum back yesterday. On point, Wall Street started the latest trading day with solid gains and then proceeded to press forward with nary a hiccup for the remainder of the session. True, there was a rapid pullback early yesterday afternoon on news that North Korea had fired a missile into the waters off the coast of Japan. That headline event sent the Dow Jones Industrial Average, once up by more than 190 points, back down to less than a 100-point advance. However, that selloff, was just a brief affair with the market regaining its footing shortly thereafter. Then, the same forces that had sent stocks soaring at the open were back in play for the balance of the day. In other news, the economy continues to show enviable strength, with data on new home sales showing a strong gain for October in a release on Monday and a survey on consumer confidence, issued by the Conference Board yesterday morning surging to its highest level in 17 years. That one-two punch suggests that the nation’s gross domestic product will advance by 3%, or more, in the current period.  The market’s comeback yesterday suggests that the shock effect of news out of North Korea is less than it had been in months past. Indeed, stocks rather quickly regained all of their gains from earlier in the day. In all, the three major composites, the Dow, the S&P 500, and the NASDAQ all had reached all-time highs in the morning. Then, the earlier nominated Jerome Powell–to be Federal Reserve Chair–turned out positive for the Street as he implied that his accession would result in few central bank changes. In sum, he suggested that he would keep the current slow tightening rate policy intact. Then, in the final hour, the bulls received more good news as the Senate took a step toward passing a bill aimed at reforming the U.S. tax code, as the Senate Budget Committee approved its tax plan, bringing the full Senate closer to a floor vote that may take place as early as tomorrow. With that news in hand, the Dow’s gain surged past 250 points. It would seem that a tax package will pass either late this year or in 2018. As the final bell sounded, the Dow was up 256 points; the S&P 500 was ahead 26 points; and the NASDAQ was better by 34 points.

In other news, Linde plc announced today that 92% of the ordinary shares of Linde AG entitled to voting rights were tendered by the end of the additional acceptance period of Linde plc’s exchange offer on November 24, 2017. The tender process has been completed and no further Linde AG shares can be tendered in the exchange offer. The business combination remains subject to the receipt of certain antitrust and other regulatory approvals and is expected to be completed in the second half of 2018.

Following the disclosure that over 57 million Uber driver and rider accounts were hacked, exposing sensitive, personal information, the National Limousine Association (NLA) is calling for Uber to halt its operations and on Congress to formally investigate the incident. While the scope of the breach is still not fully known, the NLA warns the public that this information most likely goes well beyond typical credit card exposure seen in many retail hacks. Insiders have confirmed with Reuters that Uber has increased its Debt to 1,46 billion USD.

Today’s Economic Calendar:

  • MBA Mortgage Applications
  • Janet Yellen Speech
  • GDP
  • Pending Home Sales Index
  • EIA Petroleum Status


Airbus, Rolls Royce and Siemens to develop a hybrid plane

Today’s Topics:

  • Dax Overview
  • Airbus, Rolls Royce and Siemens to develop a hybrid plane
  • SAP and Microsoft join forces
  • U.S. markets overview

With a new week around the corner the German DAX still seems unsure about which direction it wants to take. After opening at the 13011 point mark the stock Index increased rampantly to the 13052 day-high and dropped well its below opening price to the 12970 point mark. Succeeding the volatile morning the DAX has been rising ,supported by the EURUSD, for the rest of the trading day hitting the 13066 point mark, effectively increasing by 50 bp. After massive losses of 12% the German TV Mammoth ProsiebenSat1. was able to gain 2,63% throughout the trading day and thus being the biggest winner today. Meanwhile Linde, the industrial gases group which said late on Friday it had received approval from 90 percent of its shareholders for its planned $80 billion tie-up with Praxair is up 2,04%.

Airbus, Rolls-Royce and Siemens have come together to develop a hybrid electric engine as the race intensifies to advance battery technology and electric motors to lower flying costs and move away from fossil fuels. Dubbed the E-Fan X programme, the three companies anticipate flying a demonstrator aircraft in 2020 after ground tests, provisionally on a BAe 146 aircraft. “We see hydro-electric propulsion as a compelling technology for the future of aviation,” Airbus Chief Technology Officer Paul Eremenko said in a joint statement. Airbus will be responsible for the control architecture of the hybrid-electric propulsion system and batteries, and its integration with flight controls. Rolls-Royce will be responsible for the turbo shaft engine and 2 megawatt generator, while Siemens will deliver the 2 MW electric motor.

Business software giants Microsoft Corp and SAP SE have agreed to expand the use of each other’s cloud-based products and services delivered via the internet, they said on Tuesday, as they laid out a common product road map for joint customers. In a joint statement, Microsoft said it would use SAP’s S/4 HANA database to help run its core internal financial planning functions – replacing older SAP software, while SAP said it would run more than a dozen of its critical internal financial systems on Microsoft’s Azure cloud service. The long-time partners said the latest integration of their products was designed to encourage more of their joint customers to run SAP software on Microsoft Azure cloud services. Mutual customers include Coca-Cola Co, Columbia Sportswear Co and Costco Wholesale Corp. SAP encourages its customers to run its products not only on Microsoft Azure but also on rival cloud platforms from Amazon, Google, IBM and SAP’s own in-house cloud services. The two companies agreed 18 months ago to work together to integrate Microsoft Office 365, the cloud-based version of Microsoft’s flagship productivity software, into SAP, while SAP agreed to run its HANA database software on Microsoft Azure.

Wall Street got off on the right foot yesterday morning after the Thanksgiving Day weekend, with the Dow Jones Industrial Average, the Standard and Poor’s 500 Index, and the NASDAQ all racing to new all-time highs in the first hour of trading. On point, the Dow jumped by some 80 points at its morning peak, while the NASDAQ was about 10 points to the good. Optimism about holiday sales in the wake of some positive early shopping indications and as a sense that at least some tax reform measure will pass by yearend dominated the early thinking. However, this initial burst of optimism was short-lived, and as we reached the noon hour in New York, the Dow had given back just about all of its early rise (it had actually turned negative briefly), while the S&P 500 Index and in particular the NASDAQ had gone into the red, as profit taking took hold. Then, after this late-morning selling burst, the market steadied somewhat, with the Dow turning positive once more. However, the comeback was not fully inclusive, as the S&P 500 and the NASDAQ remained in the minus column as we moved into the afternoon. The mid-session pullback evolved as the early rally in the retail stocks fizzled. The gains had took hold after signs pointed to a solid showing on Black Friday. The early upturn also reflected some optimism ahead of Cyber Monday’s results. Several chains, in fact, led by Dillard’s Inc., turned nicely higher. On the other hand, stocks of other retailers faltered on the day. Meantime, as noted, investors also were watching for developments surrounding the Republicans tax plan, with the Senate vote scheduled for this week. Also in the news was Dallas Federal Reserve President Robert Kaplan, who said on Sunday that he would support a December interest rate increase. Earlier, he had been on the fence regarding such a policy action. He also warned of possible financial imbalances going forward, noting that the stock market has gone for 12 straight months without even a 3% correction. Overall, stocks wilted as the afternoon proceeded, with the aggregate mood being influenced by this news ahead of further Washington dealings. Things would change little as the afternoon wound down, so that as we entered the homestretch, the indexes remained range bound, as before, with the Dow clinging onto a small gain, while the other indexes fell back modestly. All told, as the final bell sounded, the Dow was able to hold on to a 23-point advance, while losses of one and 11 points, respectively, were tallied by the S&P 500 Index and the NASDAQ. The small-cap Russell 2000 also softened, while nearly all of the ten leading equity groups closed lower. Elsewhere, we see that oil prices, which moved lower yesterday and took some oil issues with them, have now started trading with additional early losses. Also, interest rates now are up a bit, while U.S. equity futures are showing some early gains. In sum, the day is likely to be influenced by the latest news on taxes, the economy, and the Fed.

Today’s Economic Calendar:

  • International Trade in Goods
  • Consumer Confidence
  • Richmond Fed manufacturing Index
  • State Street Investor Confidence Index

BMW to invest 200 million in battery cell site

Today’s Topics:

  • DAX Overview
  • BASF talks with DEA
  • BMW to invest 200 million
  • German business confidence at all-time high

This morning the DAX opened at the 13’000 mark and rallied up to the 13’150 point mark, noting a increase of 1,04%. This increase is fuelled by BASF and ThyssenKrupp  yielding  2,59% and 1,89% respectively. The BASF stock rose up in reaction to talks between the German chemicals group with DEA the energy group owned by Russian tycoon Mikhail Fridman. Bloomberg, citing people familiar with the matter, said that talks between Wintershall and DEA were at an advanced stage, adding the combined entity could be valued at more than 10 billion euros ($11.9 billion).

BMW will bundle its battery cell expertise in a new competence centre, the German luxury carmaker said on Friday, adding it would invest 200 million euros ($237 million) in the site over the next four years. “By producing battery-cell prototypes, we can analyse and fully understand the cell’s value-creation processes. With this build-to-print expertise, we can enable potential suppliers to produce cells to our specifications,” BMW board member Oliver Zipse said in a statement. “The knowledge we gain is very important to us, regardless of whether we produce the battery cells ourselves, or not.” The centre will open in early 2019, BMW said. ($1 = 0.8435 euros)

German business confidence rose unexpectedly in November to hit an all-time high, a survey showed Friday, adding to signs that Europe’s largest economy was heading for a strong fourth quarter. The Munich-based Ifo economic institute said its business climate index, based on a monthly survey of some 7,000 firms, rose to 117.5 from an upwardly revised reading of 116.8 in October. This was higher than a Reuters consensus forecast for a value of 116.6. “Sentiment among German businesses is very strong,” Ifo chief Clemens Fuest said in a statement. “This was due to far more optimistic business expectations. The German economy is on track for a boom.”

Todays Economical Calendar:

  • PMI Composite Flash

European shares brush off German Governement worries

Today’s Overview:

  • European shares brush off German Governement worries
  • Volkswagen raises mid-term outlook for group profits
  • Wall Street takes off ahead of Thanks-Giving week
  • Marvell M&A
  • EBA moves to Paris

After the failed Jamaica-Coalition talks the German DAX and Gold tumbled down to 12945 and 1276 respectively. The shock was short-lived and the Index move up to the 13030 in the afternoon, finally closing at the 13060 mark. The big movers in the German market were Volkswagen rallying up 2,78% and RWE incurring a loss of 1,58%. Volkswagen raised its mid-term outlook for group profit and sales on Monday, sustaining investor hopes that the carmaker can further its recovery despite shouldering billions of costs for its electric-car offensive. The world’s largest automaker by sales announced on Friday more than 34 billion euros ($40.06 billion) of spending on zero-emission cars and digital mobility services by the end of 2022, revising up an investment pledge for more than 20 billion euros made in September. VW said rebounding emerging markets such as Brazil and Russia and demand for new VW-badged sport-utility vehicles (SUVs) may together lead group revenue to exceed the 2016 record of 217 billion euros by more than a quarter by 2020. On Monday evening German chancellor Angela Merkel said she would prefer fresh elections to ruling with a minority government after talks on forming the three-way coalition collapsed. This resulted the DAX to open on the lower-end and the Euro Sterling to reach an 8-day low.

Wall Street managed to make some progress yesterday, as they commenced a new week. At the close of trading, the Dow Jones Industrial Average was ahead roughly 72 points; the broader S&P 500 Index was up three points; and the technology heavy NASDAQ was higher by nearly eight points. Market breadth was positive, with winners ahead of losers on the NYSE. From a sector perspective, the industrials and the technology issues pressed ahead, while the energy and utility names retreated. Meanwhile, there was just one notable economic report released this morning. Specifically, the Index of Economic Indicators advanced 1.2% in the month of October, which was quite a bit better than had been widely anticipated. Tomorrow, existing homes sales for the month of October are due to be released. Technically, the stock market has been holding up reasonably well lately. Looking ahead, with the year drawing to a close, it remains to be seen if the bulls can find the strength to produce a holiday rally.

In further news the Chipmaker Marvell Technology Group Ltd said on Monday it would buy smaller rival Cavium Inc  for about $6 billion, as it seeks to expand its wireless connectivity business in a rapidly consolidating semiconductor industry. Shares of Marvell were down 0.8 percent to $20.14, while Cavium was up 7 percent at $81.14 in early trading.

The European Union is relocating two of its key agencies from London to Amsterdam and Paris post-Brexit. On Monday, the EU announced that the European Banking Authority (EBA) will be moving to Paris an early sign of the potential costs for the United Kingdom of leaving the political and economic union.

Todays Earnings Calendar:

  • GameStop Corp.
  • Guess? Inc.
  • HP Inc.

Todays Economic Calendar:

  • Chicago Fed National Activity Index
  • Existing Home Sales

ProSiebenSat1 stock down 13%

Today the DAX fell to the 11900 point mark and is accounting for a loss of 1,60% one hour before close, standing at the 11930 point mark. At this time no stock is in the green range with the biggest loss coming from the German Media Behemoth ProsiebenSat1 with a booming 13% loss. Investors seem to be looking to invest in assets deemed safe such as Gold, which is up 0,6%.

ProsiebenSat1 warned that TV advertising revenues in German-language markets would decline in the third quarter and said it may look for external investors. The top German free-to-air broadcaster had already cut its TV advertising market outlook twice this year but said as recently as earlier this month it still expected a bounce-back in the second half of the year. Many major companies that rely on ad revenue have reported spending cuts by makers of fast-moving consumer goods such as Unilever, Nestle and Procter & Gamble – the world’s biggest advertisers – as they respond to weak global economic growth. Goldman Sachs downgraded ProSieben to “neutral” from “buy”. “We believe shares will remain under pressure until the first signs of market improvement (this is likely to affect other ad-exposed stocks as well),” it wrote. ProSieben shares were down 11.6 percent to 28.90 euros by 0820 GMT, at the bottom of the German blue-chip DAX and dragging the European media index down 2.5 percent.

Following a brief early tease to the upside, which saw the Dow Jones Industrial Average rise close to 50 points in minutes after yesterday’s market open, further reflections on the widespread damage caused by the hurricane that ravaged Houston and other parts of the southeastern portion of Texas over the weekend, the equity market quickly turned lower. As has been the case for much of this year, however, the pullback was relatively mild, with the Dow continuing to trade between 20 and 40 points lower, while the S&P 500 held just below the breakeven line. Breaking things down, the most of the morning saw more stocks decline than rise on the NYSE, although the differential was modest. One outlier was the NASDAQ, which gained nicely during this time. As for individual stocks, the Dow was pushed lower by a multi-point early decline in shares of Travelers. Energy prices also faltered on the damage brought on by the hurricane, with driller Schlumberger pulling back, and nearing a 52-week low in the process. As to other trading influences, with a heavy week of economic news before us, headlined by this Friday’s reports on employment and unemployment, along with key data on manufacturing, Wall Street was also consumed with the latest political news, where, this week, President Trump is expected to push his tax reform package, the timing of which could be in some jeopardy if costs to pay for the hurricane balloon in the months to come. Also, with pivotal data due on the economy, some focus will logically turn to the Federal Reserve, as it prepares to meet this month. Meanwhile, after this mid-morning Dow reversal, stocks steadied somewhat, so that as we neared the noon hour in New York, the blue-chip composite was nearing breakeven, while the NASDAQ’s gain was increasing. Then, as the afternoon got under way, stocks slipped anew, and within an hour, or so, the Dow and the S&P 500 were well into the red, while the NASDAQ’s gain, once 27 points, had eased to nine. Joining Schlumberger in the red, meantime, was food giant General Mills , with its setback bringing that quality issue to within a point of a new low. Stocks then stayed range-bound into the late afternoon, before some last minute buying almost wiped out the Dow’s deficit. Even so, at the conclusion of the session, that composite was off by only five points. A token gain, meantime, was tallied by the S&P 500 Index and a 17-point advance was inked by the NASDAQ. In the end, much of the day’s focus was on Hurricane Harvey, which was crippling the energy industry in Texas. As for the ultimate cost of the tragedy, above and beyond the human toll, it will be steep, with a partial offset from rebuilding. The potential of such rebuilding, in fact, did help one Dow stock to a hefty gain on the day, as The Home Depot jumped nearly $2.00 a share. Elsewhere, there was little excitement on this Monday in late August. Looking ahead to a new day now, we see that stocks were tumbling across Asia overnight, on jitters about North Korea that emerged late yesterday, while in Europe, the major bourses are now trading much lower, as well, on those same fears. In other markets, oil is little changed; gold, up sharply in recent weeks, is soaring again after North Korea launched another missile; and Treasury yields are down notably in a flight to safety. Finally, our futures are moving decidedly lower at this early hour, with the Dow suggesting an opening loss in excess of 100 points.