BMW to invest 200 million in battery cell site

Today’s Topics:

  • DAX Overview
  • BASF talks with DEA
  • BMW to invest 200 million
  • German business confidence at all-time high

This morning the DAX opened at the 13’000 mark and rallied up to the 13’150 point mark, noting a increase of 1,04%. This increase is fuelled by BASF and ThyssenKrupp  yielding  2,59% and 1,89% respectively. The BASF stock rose up in reaction to talks between the German chemicals group with DEA the energy group owned by Russian tycoon Mikhail Fridman. Bloomberg, citing people familiar with the matter, said that talks between Wintershall and DEA were at an advanced stage, adding the combined entity could be valued at more than 10 billion euros ($11.9 billion).

BMW will bundle its battery cell expertise in a new competence centre, the German luxury carmaker said on Friday, adding it would invest 200 million euros ($237 million) in the site over the next four years. “By producing battery-cell prototypes, we can analyse and fully understand the cell’s value-creation processes. With this build-to-print expertise, we can enable potential suppliers to produce cells to our specifications,” BMW board member Oliver Zipse said in a statement. “The knowledge we gain is very important to us, regardless of whether we produce the battery cells ourselves, or not.” The centre will open in early 2019, BMW said. ($1 = 0.8435 euros)

German business confidence rose unexpectedly in November to hit an all-time high, a survey showed Friday, adding to signs that Europe’s largest economy was heading for a strong fourth quarter. The Munich-based Ifo economic institute said its business climate index, based on a monthly survey of some 7,000 firms, rose to 117.5 from an upwardly revised reading of 116.8 in October. This was higher than a Reuters consensus forecast for a value of 116.6. “Sentiment among German businesses is very strong,” Ifo chief Clemens Fuest said in a statement. “This was due to far more optimistic business expectations. The German economy is on track for a boom.”

Todays Economical Calendar:

  • PMI Composite Flash

European shares brush off German Governement worries

Today’s Overview:

  • European shares brush off German Governement worries
  • Volkswagen raises mid-term outlook for group profits
  • Wall Street takes off ahead of Thanks-Giving week
  • Marvell M&A
  • EBA moves to Paris

After the failed Jamaica-Coalition talks the German DAX and Gold tumbled down to 12945 and 1276 respectively. The shock was short-lived and the Index move up to the 13030 in the afternoon, finally closing at the 13060 mark. The big movers in the German market were Volkswagen rallying up 2,78% and RWE incurring a loss of 1,58%. Volkswagen raised its mid-term outlook for group profit and sales on Monday, sustaining investor hopes that the carmaker can further its recovery despite shouldering billions of costs for its electric-car offensive. The world’s largest automaker by sales announced on Friday more than 34 billion euros ($40.06 billion) of spending on zero-emission cars and digital mobility services by the end of 2022, revising up an investment pledge for more than 20 billion euros made in September. VW said rebounding emerging markets such as Brazil and Russia and demand for new VW-badged sport-utility vehicles (SUVs) may together lead group revenue to exceed the 2016 record of 217 billion euros by more than a quarter by 2020. On Monday evening German chancellor Angela Merkel said she would prefer fresh elections to ruling with a minority government after talks on forming the three-way coalition collapsed. This resulted the DAX to open on the lower-end and the Euro Sterling to reach an 8-day low.

Wall Street managed to make some progress yesterday, as they commenced a new week. At the close of trading, the Dow Jones Industrial Average was ahead roughly 72 points; the broader S&P 500 Index was up three points; and the technology heavy NASDAQ was higher by nearly eight points. Market breadth was positive, with winners ahead of losers on the NYSE. From a sector perspective, the industrials and the technology issues pressed ahead, while the energy and utility names retreated. Meanwhile, there was just one notable economic report released this morning. Specifically, the Index of Economic Indicators advanced 1.2% in the month of October, which was quite a bit better than had been widely anticipated. Tomorrow, existing homes sales for the month of October are due to be released. Technically, the stock market has been holding up reasonably well lately. Looking ahead, with the year drawing to a close, it remains to be seen if the bulls can find the strength to produce a holiday rally.

In further news the Chipmaker Marvell Technology Group Ltd said on Monday it would buy smaller rival Cavium Inc  for about $6 billion, as it seeks to expand its wireless connectivity business in a rapidly consolidating semiconductor industry. Shares of Marvell were down 0.8 percent to $20.14, while Cavium was up 7 percent at $81.14 in early trading.

The European Union is relocating two of its key agencies from London to Amsterdam and Paris post-Brexit. On Monday, the EU announced that the European Banking Authority (EBA) will be moving to Paris an early sign of the potential costs for the United Kingdom of leaving the political and economic union.

Todays Earnings Calendar:

  • GameStop Corp.
  • Guess? Inc.
  • HP Inc.

Todays Economic Calendar:

  • Chicago Fed National Activity Index
  • Existing Home Sales

ProSiebenSat1 stock down 13%

Today the DAX fell to the 11900 point mark and is accounting for a loss of 1,60% one hour before close, standing at the 11930 point mark. At this time no stock is in the green range with the biggest loss coming from the German Media Behemoth ProsiebenSat1 with a booming 13% loss. Investors seem to be looking to invest in assets deemed safe such as Gold, which is up 0,6%.

ProsiebenSat1 warned that TV advertising revenues in German-language markets would decline in the third quarter and said it may look for external investors. The top German free-to-air broadcaster had already cut its TV advertising market outlook twice this year but said as recently as earlier this month it still expected a bounce-back in the second half of the year. Many major companies that rely on ad revenue have reported spending cuts by makers of fast-moving consumer goods such as Unilever, Nestle and Procter & Gamble – the world’s biggest advertisers – as they respond to weak global economic growth. Goldman Sachs downgraded ProSieben to “neutral” from “buy”. “We believe shares will remain under pressure until the first signs of market improvement (this is likely to affect other ad-exposed stocks as well),” it wrote. ProSieben shares were down 11.6 percent to 28.90 euros by 0820 GMT, at the bottom of the German blue-chip DAX and dragging the European media index down 2.5 percent.

Following a brief early tease to the upside, which saw the Dow Jones Industrial Average rise close to 50 points in minutes after yesterday’s market open, further reflections on the widespread damage caused by the hurricane that ravaged Houston and other parts of the southeastern portion of Texas over the weekend, the equity market quickly turned lower. As has been the case for much of this year, however, the pullback was relatively mild, with the Dow continuing to trade between 20 and 40 points lower, while the S&P 500 held just below the breakeven line. Breaking things down, the most of the morning saw more stocks decline than rise on the NYSE, although the differential was modest. One outlier was the NASDAQ, which gained nicely during this time. As for individual stocks, the Dow was pushed lower by a multi-point early decline in shares of Travelers. Energy prices also faltered on the damage brought on by the hurricane, with driller Schlumberger pulling back, and nearing a 52-week low in the process. As to other trading influences, with a heavy week of economic news before us, headlined by this Friday’s reports on employment and unemployment, along with key data on manufacturing, Wall Street was also consumed with the latest political news, where, this week, President Trump is expected to push his tax reform package, the timing of which could be in some jeopardy if costs to pay for the hurricane balloon in the months to come. Also, with pivotal data due on the economy, some focus will logically turn to the Federal Reserve, as it prepares to meet this month. Meanwhile, after this mid-morning Dow reversal, stocks steadied somewhat, so that as we neared the noon hour in New York, the blue-chip composite was nearing breakeven, while the NASDAQ’s gain was increasing. Then, as the afternoon got under way, stocks slipped anew, and within an hour, or so, the Dow and the S&P 500 were well into the red, while the NASDAQ’s gain, once 27 points, had eased to nine. Joining Schlumberger in the red, meantime, was food giant General Mills , with its setback bringing that quality issue to within a point of a new low. Stocks then stayed range-bound into the late afternoon, before some last minute buying almost wiped out the Dow’s deficit. Even so, at the conclusion of the session, that composite was off by only five points. A token gain, meantime, was tallied by the S&P 500 Index and a 17-point advance was inked by the NASDAQ. In the end, much of the day’s focus was on Hurricane Harvey, which was crippling the energy industry in Texas. As for the ultimate cost of the tragedy, above and beyond the human toll, it will be steep, with a partial offset from rebuilding. The potential of such rebuilding, in fact, did help one Dow stock to a hefty gain on the day, as The Home Depot jumped nearly $2.00 a share. Elsewhere, there was little excitement on this Monday in late August. Looking ahead to a new day now, we see that stocks were tumbling across Asia overnight, on jitters about North Korea that emerged late yesterday, while in Europe, the major bourses are now trading much lower, as well, on those same fears. In other markets, oil is little changed; gold, up sharply in recent weeks, is soaring again after North Korea launched another missile; and Treasury yields are down notably in a flight to safety. Finally, our futures are moving decidedly lower at this early hour, with the Dow suggesting an opening loss in excess of 100 points.

Ryanair files anti-trust complaint

  1. DAX Review
  2. U.S. Review
  3. Ryanair files anti-trust compliant
  4. Amazon 16 billion bond release
  5. Gigaset Earnings
  6. Economic Calendar

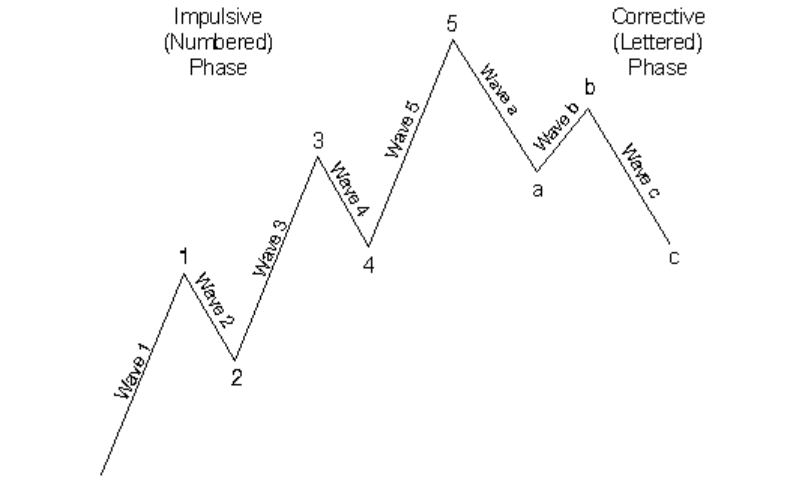
In case you missed out Elliott Wave Technical Analysis Report, make sure to catch up on it.

The DAX is recovering from its recent losses. 3 hours before close the German Index is up by 0,83% reaching the 12278 point mark. With this actual form it does seem that the DAX will be breaking its August high. There are no major international signals, as the Brent and Gold seem have to stabilized at 50 USD and 1270 USD respectively.

Following a strong equity market rally on Monday, as simmering tensions eased a little with North Korea, and fears of an imminent armed conflict with that nation lessened to a degree, Wall Street calmed down a bit yesterday morning, too. Indeed, after a small early extension to the rally in the first few minutes of yesterday’s session, stocks faltered somewhat within the first hour of trading, and an early 35-point gain in the Dow Jones Industrial Average quickly faded, with that blue-chip composite falling into the red during the second hour of trading. The other averages went into the red, as well. Meantime, a big individual story, one day after the shift away from North Korea, was at giant home improvement retailer The Home Depot, which issued quarterly results yesterday. And while the top and bottom-line results were better than expected, the gains, and the raised full-year forecast did not satisfy the Street, as that stock tumbled, losing nearly 4% of its value early on. The loss in HD turned the Dow negative, costing that index some 40 points. However, after that initial turn down by the Dow, that index returned to the black shortly thereafter. Also in the retail category weak earnings hurt Coach stock in early dealings. Still, the resilience of the bulls was evident yesterday, with that late-morning attempted comeback in the Dow. Meanwhile, in other market moving news, the Commerce Department reported that retail sales had posted an increase of 0.6% in July. That was above the 0.4% rise forecast. Also, June’s result was pared back from a rise of 0.4% to one of 0.3%. Excluding motor vehicle sales, core retail spending was ahead of 0.5%. Here, too, the gain was above consensus. Contributing to the pickup were sales of furniture and home furnishings, and building materials. Sales over the Internet soared, meantime, advancing by 1.3%. The market remained in somewhat of a mixed pattern as the noon hour arrived in New York, with the Dow near the breakeven line, and with the S&P 500 and the NASDAQ each off incrementally. The small-cap Russell 2000 and the S&P Mid-Cap 400 also were in the red, but in a more meaningful way. As has been the case recently, it was the retail group suffering once again, with steep losses in some high-profile names, such as Under Armour. Also, more stocks were lower than higher on the Big Board at that time, by a count of two-to-one while among the core groups, energy, basic materials, and consumer stocks were leading things lower. The weak tone persisted through the middle of the afternoon, and while the Dow held near the breakeven line, and the large-cap S&P 500 and the NASDAQ were just down incrementally, the smaller indexes and the advance-decline ratio were notably off. It was, to that point, a somewhat sobering day, even as the economy continued to show relative strength and the news out of North Korea was somewhat reassuring, for now. The equity market then would firm up slightly as the session wound down, but the overall weaker tone would persist into the close. When all the numbers were in, the Dow, with some last-minute selling, would end the session ahead by just five points; the S&P 500 would conclude matters just about where it began them; and the NASDAQ would end the day off seven points. Losing stocks easily led gains, though, and the small- and mid-cap categories showed noted weakness.

Germany on Wednesday rejected a claim by budget airline Ryanair of a conspiracy behind efforts to keep bankrupt rival Air Berlin afloat until a new owner is found. The Irish airline lodged a complaint with European Union competition authorities after Air Berlin filed for bankruptcy protection and then got a 150 million euro ($177 million) loan from the German government. Ryanair said late Tuesday there’s “an obvious conspiracy” between the German government, Lufthansa and Air Berlin. The loan will help Air Berlin to keep flights running for the next three months, while it is negotiating a possible deal with Lufthansa and another unnamed carrier, reported by German media to be easyJet. A spokeswoman for Germany’s Economy Ministry said it was “absurd” to claim that the rescue package had been staged. Beate Baron told reporters in Berlin that the government expects the loan to Germany’s second-largest airline to be repaid. Air Berlin filed for bankruptcy protection Tuesday after its main shareholder, Abu Dhabi-based Etihad, said it would make no more financing available following years of unsuccessful turnaround attempts. The airline, which carries some 80,000 people a day mostly on short-haul destinations, made a loss of about 782 million euros last year.

Amazon.com Inc. on Tuesday completed a $16 billion bond deal to fund its planned $13.7 billion acquisition of Whole Foods Market Inc. The issue came a day after ratings agency Moody’s Investors Service assigned the deal a Baa1 rating and revised Amazon’s credit outlook to positive from stable. S&P Global Ratings assigned the credit a higher rating of AA-minus last week. Amazon raised $16 billion in a seven-part offering that included a 40-year tranche, underwritten by Bank of America Merrill Lynch, Goldman Sachs and J.P. Morgan Chase. As expected, the bonds priced at the tight end of guidance, but the new concessions were still attractive, according to research firm CreditSights, which had upgraded its recommendation on Amazon’s bonds to outperform from underperform based on the initial price talk. Initial price talk on the 10-year tranche was 110 basis points above comparable Treasurys, which later tightened to Treasurys plus 90 basis points. CreditSights analysts led by Jordan Chalfin said at the price, the notes were still a bargain.

Gigaset reported a drop in first-half sales and EBITDA but reiterated its outlook for higher sales over the full year, thanks to growth in new market segments like smartphones. In the first half, smartphone revenues rose to EUR 3.7 million from EUR 1.1 million a year earlier, following the launch of two devices. Over the first six months of 2017, total revenues fell 3.6 percent to EUR 128.3 million due to a continued contraction in Gigaset’s main market, cordless home phones. Sales in the consumer segment fell to EUR 98.1 million from EUR 110.7 million a year ago, while the business market grew 25.7 percent to EUR 25.4 million, driven by strength in its home market Germany.  EBITDA fell to EUR 5.7 million from EUR 10.6 million in the first half of 2016, hurt by increased spending on marketing and R&D, including the ramp-up of mobile sales. Excluding the extra EUR 4.6 million in costs, EBITDA would have been largely stable for the full year, Gigaset said. Free cash flow was a negative EUR 24.1 million versus an outflow of EUR 13.1 million a year earlier.  Despite the lower H1 results, Gigaset maintained its outlook for higher revenues over the full year, with a low double-digit million euro increase thanks to the expanding smartphone business. Core EBITDA is expected to reach EUR 15-25 million over the year, while cash flow should be just a mid single-digit million euro outflow.

Today Economic Calendar:

  1. MBA Mortgage Applications
  2. Housing Starts
  3. Atlanta FED Business Inflation Expectations
  4. EIA Petroleum Status Report
  5. FOMC Minutes


Technical Analysis: Elliott Waves

In todays Weekend Special Edition we will be discussing Elliott Waves. For some technical analytsts Elliott Waves are a vital tool. As any investor the Technical Investor will want to have a reliable forecasting method. The possibility of easy profits by forecasting the market has been the underlying force that motivates so many investors. Elliott’s market model relies heavily on looking at price charts. Practitioners study developing trends to distinguish the waves and waves structures that we will refer to later in this article. The application of the Wave Principle is a form of pattern recognition. To obtain a full understanding of the Wave Principle including the terms and patterns, I recommend Elliott Wave Principle by A.J. Frost and Robert Prechter.

The Elliott Wave Theory was introduced by Ralph Nelson Elliott during the 1930’s. Elliott a full-time accountant believed that stock trends follow a repeating pattern which can be forecasted both in the long and in the short term. The Elliott Wave Theory was published in his book “The Elliott Wave Principle” in 1938. Using data from stocks he concluded that what seems to be a chaotic movement, actually outlines a harmony found in nature. Elliott’s discovery was completely based on empirical data, but he tried to explain his findings using psychological reasons. The main principle of this theory was that a pattern consists of eight waves as can be seen in the Image below.

null
It is visible that Wave 1, Wave 3 and Wave 5 follow the cyclical trend while waves 2 and 4 correct the underlying trend waves A, B and C correct the overall trend , while Wave A and C follow the correction and Wave B resists. Elliot observed that each wave consists of smaller waves which follow the exact same pattern as is shown in the Image below, thereby forming a super-cycle. The numbers in the Image represent the number of waves when counted in a different scope. For example the whole diagram represents two big waves, the impulse and the correction. The impulse consists of 21 usb-waves which in turn consist of 89 smaller waves, while the Correction wave consists of 13 sub-waves, which in turn, consist of 55 even smaller waves. As can be observed all of the above numbers are part of the Fibonacci series. According to the Elliott wave theory, when Elliott first expressed his theory he was not aware of the Fibonacci series.

image
Elliot believed that there are nine cycles, of different durations, the bigger of which, is formed by the smaller ones. From the largest to the smallest cycles there are:

  1. Grand supercycle: multi-century
  2. Super-Cycle: multi-decade (40 to 70 years)
  3. Cycle: one year to several years
  4. Primary: a few months to a couple of years
  5. Intermediate: weeks to months
  6. Minor: weeks
  7. Minute: days
  8. Minuette: hours
  9. Subminuette:minutes

The duration of these cycles varies from minutes to decades. Each pattern (cycle) is outlined by the following rules:

  1. The Second Wave cannot be longer than the first wave and cannot return to a lower price than that set at the beginning of the first wave
  2. The third wave is never the smallest wave compared to the first and the fifth.
  3. The fourth wave does not return to a lower price than the price found at the end of the first wave. The same applies for wave a.
  4. Usually the third wave shows a greater dynamic, except in some cases where the fifth wave is extended (the case when the fifth wave is made up of five smaller waves)
  5. The fifth wave usually leads to a higher point than the third.

When it comes to the interpretation of the waves we will present a short overview of the general dynamic of the waves. The first wave is the “new beginning” of an impulse. Opening a position at this point will be the most profitable scenario. It is difficult to differentiate it from a correction of a previous downtrend, and therefore it is not a powerful wave. Most investors prefer to wait for better timing. The force behind the wave pattern is the number of investors that decide to enter and exit the market at a given time. After some initial winnings, investors decide to exit the market as the price becomes higher, and the stock becomes overpriced for these few investors. This behavior translates in the second wave. As the price begins falling, the stock becomes more attractive for a great number of investors that regretted not having entered the market during the first wave. As the price begins falling, the stock becomes more attractive for a greater number of of investors that regretted not having entered the market at a higher price. Those who entered in the beginning of the wave, are satisfied with their winnings, and have most likely exited the market. Investors realize that the price has reached a level making it difficult to attract any further investors. Demand begins falling, which leads to the fourth wave. Major investors are out of the market, waiting for the end of the fourth wave, to enter again and reap in the profits of the fifth wave. It is important to note that the fourth and the fifth wave are the easiest ones to follow, as they come after the third wave which is the easiest to spot, due to its length, power and speed. Major investors have bought stocks on lower prices, from investors that had bought them during the end of the third wave who feared the price might go lower. However as the major investors enter the market again, they create a small hype, the fifth wave, smaller than the third wave, which usually reaches the peak of the third wave and sometimes even higher. Investors who know the market, know that the market is extremely overrated and therefore have exited the market. Wave A is a corrective wave which is often mistaken for a second wave. This explains wave B. Smaller investors think that wave A corrected the price enough, so that it can lead to an upward trend. Unfortunately, this is the Wave where most smaller, and occasional investors lose huge amounts of money, as Wave C starts, pushing the price lower until the price gets underrated again, for a new pattern to start.

The above explanation is by no means a statistical explanation of the wave behavior, but explains the difference between major and occasional investors and their knowledge of the market. It is exact to know the exact wave patterns , otherwise it is very easy to misinterpret signs. It is important to note that the following explanation regards an overall impulse trend. The opposite would happen in case of an overall correction.

Atsalakis et al (2011) compared the Elliott Wave principle to a Buy and Hold Strategy with remarkable results. The Elliott Wave Principle was tested with the stock of the National Bank of Greece. A paper portfolio worth 10.000 Euros was simulated. Buy and sell decisions did not take into account the confidence index, as it is subjective, depending on the risk the investor is willing to take, even though a threshold of 52% is widely acceptable. Stocks were bought whenever the forecast was positive, and the position was closed when the forecast became negative. Transaction costs were not taken into consideration. The system was tested for period April 2007 to November 2008, for a total of 400 trading days.s. It is worthy to note that this period also includes the great recession of October 2008, were the system achieved interesting results. For the whole period of 400 trading days, the hit rate was 58.75%, mainly due to the crisis. By breaking this period in four sub-periods of 100 observations, the hit rates achieved are 58%, 64%, 60% and 53%, respectively. During this period of 400 trading days, the WASP system made 63 transactions. This gives a rough average of 1 transaction every 6 days.

null